
The second wave of the COVID-19 pandemic is sweeping through the world. It reached first the U.S., Europe, North Africa and the Middle East. By mid-November 2020 it started being visible in Eastern Asia (e.g. Reuters Covid-19 Global Tracker: World and Asia and the Middle East).


By the end of November 2020, South Korea and Japan face a rising number of cases. Yet their outbreak bears, so far, no comparison whatsoever with what happens in Europe or the U.S..
Meanwhile, international news on China tend to focus on the economy and economic recovery (e.g. James Hyerczyk, “Asia-Pacific Shares Down Across the Board; China Reports Upbeat Factory Activity“, Nasdaq, 30 November 2020). The COVID-19 pandemic appears to be almost forgotten, even though China was the place where the pandemic first broke out.
The situation in China, besides notably the very positive outlook taken regarding soon forthcoming vaccines, is a key factor in the optimistic mood of many actors.
What is thus truly happening in China as far as the COVID-19 pandemic is concerned? Has China truly become a much safer place than elsewhere, thanks to the way it now handles the pandemic? Can we estimate the prospects of the sanitary situation in China for the near future? What are the likely impacts of the way China will handle or mishandle a possible second wave? Does that truly matter considering the coming vaccines? How can we think the world both with the way China handled the pandemic and with the coming vaccines?
This article addresses the first of these questions and looks at the situation in China in terms of contagion and clusters.
China, an amazing control of the COVID-19 pandemic
Since the COVID-19 broke out in China in December 2019 and January 2020, starting the global pandemic, and the drastic measures implemented ended on 8 April 2020 (e.g. CNN), China has been amazingly almost free of COVID-19.
China registered COVID-19 4.750 deaths up to 28 November 2020. On 23 then 25 September China reported the death of one person for each date, then another one on 4 November, one on 5, one on 10 November and one (in Hong Kong) on 28 November (dxy network, 1point3acres).
It registered 93.113 COVID-19 symptomatic cases since the beginning of the pandemic up to 26 November 2020 and 93.465 up to 30 November 2020 (dxy network).
This is to compare with 62,57 million cases worldwide as of 30 November 2020, and notably the 18,02 million cases for Europe, and 13,38 million cases for the U.S. (ECDC). In other words in one day, between 29 and 30 November, there has been twice as many cases in Europe as since the beginning of the pandemic in China. In the U.S., for the same day there has been 1,5 times as many cases as since the start of the pandemic in China.
Thus, so far, China does represent a negligible share of the cases, even though the first pandemic outbreak started with China.
Learning by controlling clusters
It is not that China is COVID-19-free out of a miracle. It obtains these incredibly results through an extremely rigorous and efficient control of the pandemic. Indeed, throughout the last months, when the prospects for possible clusters emerged, China took sweeping and efficient measures that allowed for controlling rapidly the new outbreak.
For example, over the summer, on 9 June, a cluster started in Beijing, spread to Hebei’s nearby province and included more than 330 symptomatic cases (WHO A cluster of COVID-19 in Beijing, People’s Republic of China, 13 June 2020; Bloomberg, “Xinjiang Covid Outbreak Is China’s Biggest Since Summer“, 2 Nov 2020; Bloomberg News, “China locks down county of 400,000 as COVID-19 cluster reemerges near Beijing“, 29 June 2020). The origin of the contagion was most likely the contamination of a salmon vendor in Xinfadi, the biggest Beijing wholesale market, as the virus was detected on his chopping board (Ibid,). The authorities controlled the cluster in Beijing on 19 June, and cases had disappeared by the start of July.
Then, in Dalian on 22 July, a new cluster began (Xinhua, “Containing sporadic COVID-19 outbreaks the Chinese way“, Beijing Review, 27 November 2020). Its origin was the contamination of “a worker at a local seafood processing company” (Xinhua, 29 August 2020). The Dalian cluster included 92 locally transmitted COVID-19 cases and 26 asymptomatic cases. It was fully cleared on 29 August (Ibid,).
In Qingdao, Shandong province, on 11 October, three new COVID-19 cases were detected (Xie Chuanjiao, “Source of Qingdao outbreak identified“, China Daily, 19 October 2020; Yuhan Xing, Gary W.K. Wong et al., Rapid Response to an Outbreak in Qingdao, China, The New England Journal of Medicine, 18 November 2020). The cluster would count only 13 symptomatic cases and was considered as controlled on 16 October, as no new cases emerged (Ibid.). The origin of the cluster was two port workers who had unloaded imported goods (Xie Chuanjiao, ibid) and were in contact with other ship workers (Yuhan Xing, Gary W.K. Wong et al.). Both had tested positive on 24 September 2020 (Ibid.). Then, the virus spread through the hospital (Ibid.).
On 24 October 2020, a new cluster started in Xinjiang with an asymptomatic case being detected. On 2 November, the autonomous region counted 57 mild cases of COVID-19 and 233 asymptomatic cases (Bloomberg, “Xinjiang Covid Outbreak Is China’s Biggest Since Summer“, 2 Nov 2020). Millions were tested in and around the city of Kashgar where the cases were detected, and all those who were positive were isolated (Ibid., BBC News, “Covid-19: China tests entire city of Kashgar in Xinjiang“, 26 October 2020).
So far, thus, clusters have emerged and, each time, they have been successfully quelled. What is the current situation?
Rising contaminations and an increasing number of clusters
Rising daily contaminations
Since 17 November, if we look at the country-wide situation in China, the number of daily newly diagnosed symptomatic cases has been increasing slightly, as shown in the daily figures below, displayed on a fortnightly graph. Note that the last graph changes scale and that the ordinate axis now goes up to 150 cases.


These increases, however seem to concern mainly Hong Kong and Taiwan, as both the daily reports of the Chinese National Health Commission and the Chinese network of medical doctors – dxy.cn – include them, alongside Macau, in their statistics.*
As a result, the current number of ongoing infectious cases started rising again. Nonetheless, compared with the January 2020 outbreak the curve looks almost flat. This would be even more the case should we look at these figures in comparisons with other countries and continents.


In China the number of confirmed symptomatic COVID-19 patients reached 905 cases on 26 November 2020, 980 on 27 November, 1145 on 29 November 2020 and 1245 cases on 30 November according to the dxy.cn statistics. Out of these, detected asymptomatic cases went from 348 on 23 November to 279 on 28 November (National Health Commission). Thus, the number of asymptomatic cases decreases slightly.
An increase of symptomatic cases is thus taking place, mainly in Hong Kong and, in a lesser way, in Taiwan.
Let us now look at clusters and at the geographical spread on the Chinese territory
A rising number of clusters
Beyond rampant COVID-19 cases considered as identified and quarantined, on 27 November 2020, Chinese media singled out three main outbreaks taking place: in Tianjin – 15 symptomatic cases on 27 November 2020, Shanghai – 62 symptomatic cases on 27 November 2020, and in Inner Mongolia – 23 symptomatic cases on 27 November 2020), in the border city of Manzhouli (Xinhua, “Containing sporadic COVID-19 outbreaks the Chinese way“; “Manzhouli coronavirus cases likely imported“; China Daily, November 27, 2020).
In Manzhouli, the outbreak started on 21 November 2020. On 27 November, it counted 11 cases, 1 asymptomatic case and a suspected case (“Manzhouli coronavirus cases likely imported“). Imported infections triggered the cluster (Ibid.). According to dxy.cn, the cluster there went from 23 symptomatic cases on 27 November 2020 to 18 symptomatic cases, out of which 4 were imported, on 29 November. This would let us assume the authorities control the cluster.
Compared with the three clusters the media reported, the dxy.cn epidemic map for 27 November below shows higher numbers of COVID-19 cases in 7 provinces and cities (plus Taiwan and Hong Kong). These possibly could indicate future clusters, on top of the three identified. Indeed, considering a very nature of a pandemic, just one case represents a danger of contamination. This is even truer with the COVID-19 considering asymptomatic cases and pre-symptomatic contagion (see Helene Lavoix, Dynamics of contagion and the COVID-19 Second Wave, The Red Team Analysis Society, 3 June 2020). Hence, the extreme caution and care shown by the Chinese authorities.
The next map, for 28 November, shows one province (Anhui – the blue arrow) now free of detected COVID-19 cases. In the meanwhile, a new province (Zhejiang) joined its sisters with a higher number of cases. The next day, on 29 November, one more province was added, Gansu with only one case (the red arrow). Here, note that we are still dealing with very low number of cases, from 10 cases in Zhejiang, 12 in Tianjin, and up to 51 (but decreasing number of cases) in Shanghai.
We thus seem to have a rise in the number of possible clusters, compared with the previous six months. Yet, each time a rapid control leads to a decreasing number of cases.


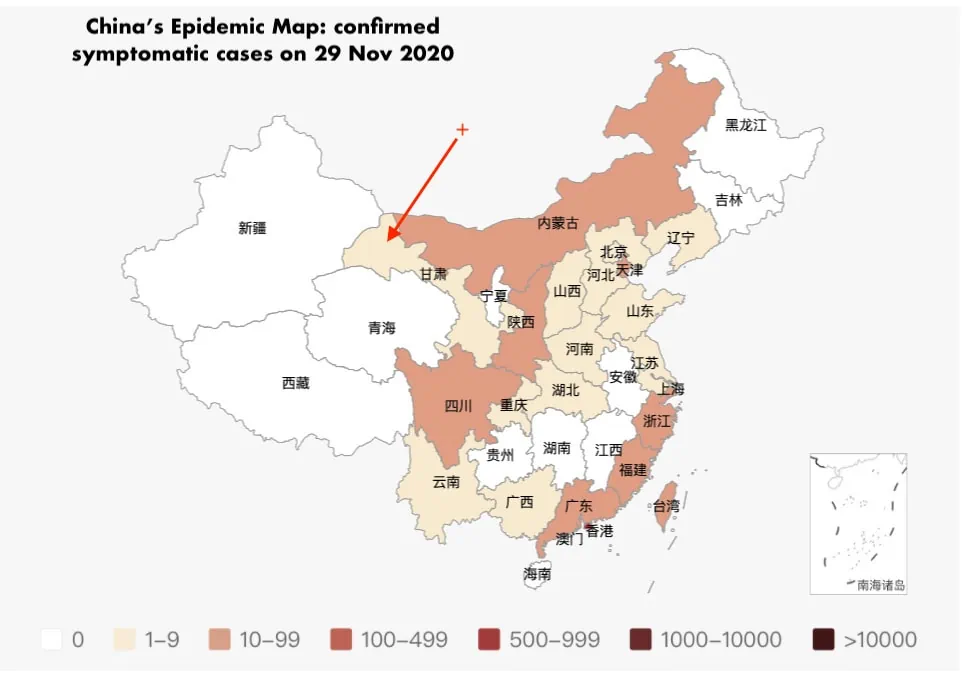
Interestingly, those provinces with more COVID-19 positive cases seem to surround China. This indicates once more the key importance of exchanges in the spread of the pandemic.
Thus, it seems that China is facing indeed an increase in cases, as elsewhere. Yet, China’s measures also would seem, so far, to show efficiency and even mastery at controlling the pandemic. With the next article we shall look further at these measures to assess the possible scope and intensity of the second wave in China. Will it remain almost flat as is now the case? Or, on the contrary, should we expect surprises?
*We should also note a discrepancy between the country-wide statistics of the Chinese National Health Commission and the dxy.cn network. The latter works with provincial statistics. The figures in this article rely mostly on the dxy.cn network.
Featured image: Image par Roger Mosley de Pixabay – Public Domain
“Compared with the three clusters the media reported, the dxy.cn epidemic map for 27 November below shows higher numbers of COVID-19 cases in 7 provinces and cities (plus Taiwan and Hong Kong). These possibly indicate clusters.”
This is most likely wrong, and the fact that the author even makes this conjecture shows that, scientific credentials notwithstanding, she does not understand much about the actual situation in China. Thousands of travelers are still arriving in China each day (mostly Chinese returning from abroad, but other also). All are subject to mandatory centralized 14-day quarantine in a hotel. Most or all of those symptomatic cases in other parts of China outside of the three major clusters are most likely attributable to people who tested positive and then became symptomatic during this quarantine period. As soon as somebody tests positive in quarantine, they will be transferred to an infectious disease ward in a hospital under strict quarantine and observation. These are simply imported cases. It doesn’t mean there is community transmission or new clusters developing.
You should read more attentively… you missed the word possibly. You are on a website where we work on uncertainty and scenarios, and where usage of words does matter. You also missed the fact that I highlighted exactly what you explained with the opening sentence “Beyond rampant COVID-19 cases considered as identified and quarantined.”
You also should have gone on reading as I wrote: “We thus seem to have a rise in the number of possible clusters, compared with the previous six months. Yet, each time a rapid control leads to a decreasing number of cases.”… which is in substance what you think I have not understood. Of course you will note the use of the words “seem” and “possible”…!
You also missed the fact that I ask exactly that question (will the curve be flat considering the measures taken, or not) at the end of the article, and that the next article will be about the measures taken by the Chinese political authorities.
Asking questions – what you call conjecture – is fundamental to proper strategic foresight and warning. You never ever remove a scenario that is unlikely or implausible, you keep them and then add the very low likelihood, if needed. What you promote is censorship, mind-forged manacles. This is how surprise takes place and this is exactly what we fight.
On top of it you make it aggressively, which is unpleasant and again is counterproductive in terms of understanding and foresight.
Maybe you should explain why you felt you needed to be so agressive, what are your motivations and interests here?