With an additional focus on the shares of uranium reserves and resources of actors
The second tool of our series to consider and visualise geopolitical influence and companies’ exposure to geopolitics in the world of uranium.
The world is witnessing a nuclear renaissance. As the global community strives to reduce greenhouse gas emissions to net zero by 2050 and addresses the growing energy demands driven by the rise of artificial intelligence, the need for nuclear energy is becoming increasingly crucial. Consequently, the demand for uranium is rising, necessitating its mining.
Geopolitics is increasingly key for uranium mining. The security of supply is crucial and must be factored in.
The graph and its data tables, the report and the user manual, help you considering and visualising geopolitical influence and companies’ exposure to geopolitics in the world of uranium mining.
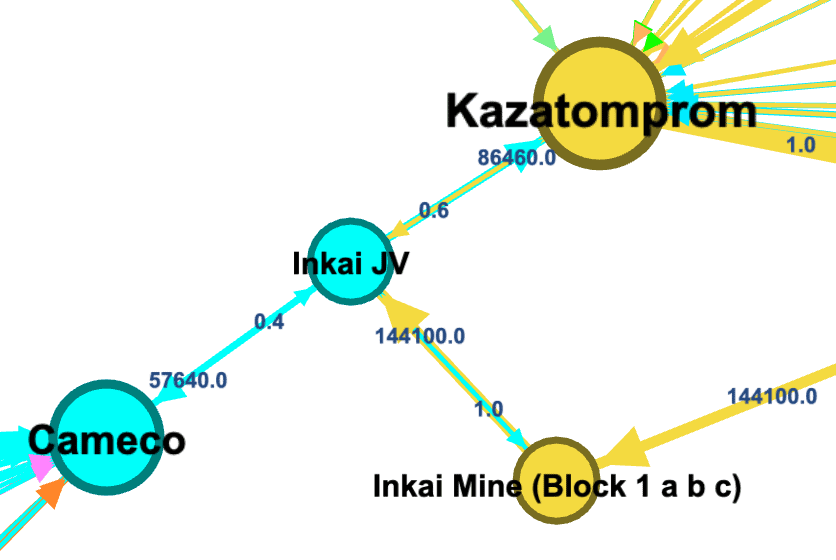
This graph first represents the structure for the world of uranium. It focuses on the one hand on uranium endowment through mines for countries, and on the other on mining companies and their complex web of shareholdings.
The package includes an update to account for the changes of partners for some JVs of Kazatomprom: from Russia to China (17 Dec 2024).

In addition, this version gives you access to the amount of uranium reserves and resources of the various players as they ‘spread’ around the world through the companies’ complex shareholding network.
This product thus builds upon the structure given by The World of Uranium – 1: Mines, States, Companies and uses it to show the shares of uranium reserves and resources for each company and/or state.
It delves into the world of uranium mining from a geopolitical standpoint, using 12 case studies to illustrate various dynamics. These cases not only shed light on the intricacies of the industry but also demonstrate practical applications of the database and its graph.
Intelligence and law enforcement agencies use graphs for security related matters, such as fight against criminal networks and counter-terrorism. We put this experience and knowledge, as well as our expertise in political science, international relations and geopolitics, at the service of the world of uranium.
12 Use Cases:
- Who owns what
- Actors to court
- Which actor is the most important in terms of reserves and resources?
- Which actor (minus the Olympic Dam Mine) is the most important in terms of R&R?
- Assessing the impact of a new operation or transaction – The case of UEC and Rio Tinto
- Losing the Jabikula Uranium Deposit
- The Sapporo 5 and Russia
- Sino-Russian Extension
- What if Niger’s two “vacant” deposits were given to Russia (or China)?
- Mines and Companies
- A global vision of mines according to their reserves and resources, the weight of the Olympic Dam Mine
- A global vision of mines according to their reserves and resources, without the Olympic Dam Mine
- The new global vision of mines, companies, reserves and resources after changes in JV’s partners of Kazatomprom (17 Dec 2024).
Extensive Data
The graph’s database covers:
- 30 states involved in uranium mining as producers or operators through private or public companies.
- 164 companies, subsidiaries and organisations including 40 main consolidating companies;
- 136 mines, deposits and projects, including 126 mines and deposits with their reserves and measured and indicated resources, as well as 19 mills.
Data is updated to mid-July 2024, using as much as possible 2023 annual reports (published in 2024).
The fusion between Paladin and Fission is included and considered as successful.
Use “The World of Uranium – 2”
Interact with the graph according to your needs, and:
- Find out the reserves and resources held by different actors, public or private, resulting from the complex web of shares.
- Visualise the global impact of the changes of partnership in Kazatomprom JVs, from Russia to China on the global uranium mining field.
- Visualise these global uranium reserves and resources per country and go beyond textual and usual generic chart-based perspectives.
- Visualise the system and its parts and go beyond a fragmented perspective.
- Visualise spheres of influence and moves to extend these areas.
- Visualise groups with few or no linkages with the rest, and which, as a result, could become the target of interest and “influence” operations.
- Create “what if” scenarios for mining permits holding, merger and acquisition, and visualise how these can be exposed to geopolitics.*
- Present your arguments with crisp graphs.
- Compare mines visually.
- Use filters to find mines.
- Use filters to find mining permits holders.
- Compare companies and their uranium reserves and resources
- Etc.


Download a sample of a very small part of the graph to experiment with the high quality pdf: Scale up and down the document.
Contact us for further information.
* If you amend or change the structure of the graph and its main data to make scenarios, make sure that the existing figures remain correct. The software does recalculate weighted averages for parents and children nodes and usual graph statistics, but, for example, does not propagate results throughout the network if the weight of an edge is changed. If you are unsure, do not hesitate to contact us.
The Red Team Analysis Society declines any responsibility regarding the way the user will use the database, the graph with various software products, the results obtained, as well as the decisions taken as a result of this usage.
The graph nodes and edges
The graph is constructed with:
- 389 nodes: Countries (category S as State), Mines (M), Companies (C), Mills (P) presented by row, with, for each node, their country, category, calculated reserves and M&I resources in tU / tonne (kgU as U3O8), given reserves and M&I resources of U3O8 in original unit of reference, and notes and reference. – 399 nodes for the post Kazakh operations graph.
- 848 edges (arrows – the relationships between the nodes): for each edge, a weight, either a % of shares held or, when relevant, calculated reserves and M&I resources in tU / tonne (kgU as U3O8), then the given reserves and M&I resources of U3O8 in original reference unit, and, finally, references and notes – Note: on the visualisation you see at once both the share and the calculated reserves and M&I resources in tU (when relevant). 859 edges for the post Kazakh operations graph.
- Conversion used:
1 lbU3O8 = 0.384647 kgU as U3O8
1 tU / tonne (kgU as U3O8) = 2599.79 lbsU3O8
Files, User Manual and Report
Files are available under various graph format (.gephi and .graphml) and as .csv.
The user manual explains how to use the database and its graph using the free open source reference software Gephi.
Onboarding one hour training with Dr Lavoix to use The World of Uranium can also be arranged. Contact us for further information.
On top of the basis version, you will get a series of different versions of the graph and its visualisations, provided in an additional single file (a Gephi file). These versions exemplify the graph in action, highlighting different geopolitical perspectives.
These graphs, the question to which each graph answers, an explanation on how to obtain the visualisation and an analysis outline are further detailed in the companion report, which also highlights how the database has been constructed.
What is included in your purchase
Files
1- The original graph and its data tables: a series of files which contain the original database and its graph
- To use with Gephi (leading third party software open source and free)
xxx.gephi
- To use with yEd Graph Editor `(third party software by yWorks)
xxx.graphml
- Other formats (3 files)
xxx.graphml
edgesxxx.csv
nodesxxx.csv
1.1- An updated version of the original graph and its data tables including the freeze of Jubilaka in Australia and the operations between UEC and Rio Tinto and the 17 Dec 24 changes in partnerships in Kazatomprom JVs.
- To use with Gephi (leading third party software open source and free)
xxxupdate 20 12 24 Kazakh.gephi
2- The “graph in action”: a file with 9 ready to use workspaces, displaying different versions of the graph and its visualisation plus pre-prepared filter
- To use with Gephi (leading third party software open source and free)
xxx.gephi
The manual: Use Gephi for the World of Uranium
A step by step user manual, with detailed screenshots, explaining how to install then use Gephi for the World of Uranium.
The companion report: The World of Uranium -2, Mines, States, Companies and Shares of Reserves and Resources – Database, Graph and Examples
This report presents the rationale behind the construction of the graph, the scope, and, as examples, various versions of the graph with explanation and analysis outlook. This report is the companion to the file “the graph in action”.
Purchasing process
For security reasons, as you proceed with your purchase, you will have to create a log in to our website to be able to complete it.
Once you have completed your purchase, you will receive an email confirming your order with a link to a zip file you will be able to download.
You will also be able to access the zip file from your account on our website: Log In >> My account & memberships
Don’t hesitate to contact us contact@redanalysis.org
