(Art direction and design: Jean-Dominique Lavoix-Carli)
The U.S. has planned for a Nuclear Renaissance. It aims to reach 300 GWe capacity by 2050 for nuclear energy and envisions two scenarios to reach this goal (U.S. Department of Energy -DOE, Pathways to Commercial Liftoff: Advanced Nuclear, 30 September 2024).
Developing the future American fleet of reactors implies facing formidable challenges and uncertainties (Hélène Lavoix, “Towards a U.S. Nuclear Renaissance?” The Red Team Analysis Society, 15 October 2024). Now, the U.S. must also be able to fuel the nuclear renaissance. This means the U.S. will need first to have uranium, which demands mining it, before even thinking about processing it from conversion to fuel fabrication through enrichment.
How do American nuclear objectives translate in terms of uranium requirements? What does that imply?
In this article we focus on the uranium requirements of the U.S. nuclear renaissance and ways to meet them, including in terms of security of supply. Then, with the next article we shall look at the way the American uranium requirements of the nuclear renaissance and the current supply policy of the U.S. may impact the global uranium field, notably in the light of China’s nuclear surge, with feedback on American options to supply its uranium.
For these two articles we use the DOE scenario 1: nuclear units start being constructed in 2025 for deployment in 2030, and + 13 GWe per year are added from 2030 onwards to reach 300 GW of nuclear capacity for 2050 (US DOE, 2024 Pathways, p. 39).
Scrutinising the U.S. Uranium Requirements
According to the DOE, to meet its objectives, the U.S. would need to “access to ~55.000-75.000 MT per year of U3O8 mining/milling capacity to support 300 GW of nuclear capacity” (Ibid. p.57).
American current uranium requirements are 21.388 tU as U3O8 (18.137 tU – WNA, “World Nuclear Power Reactors & Uranium Requirements“, 1 Oct 24).
If we assume that all new reactors constructed are at least Gen III(1) (Generation III), then we can consider that the new uranium requirements correspond to 192 tU as U3O8 per GWe per year at 0.25% tails assay (WNA, “Nuclear Fuel Cycle Overview“, May 24).(2)
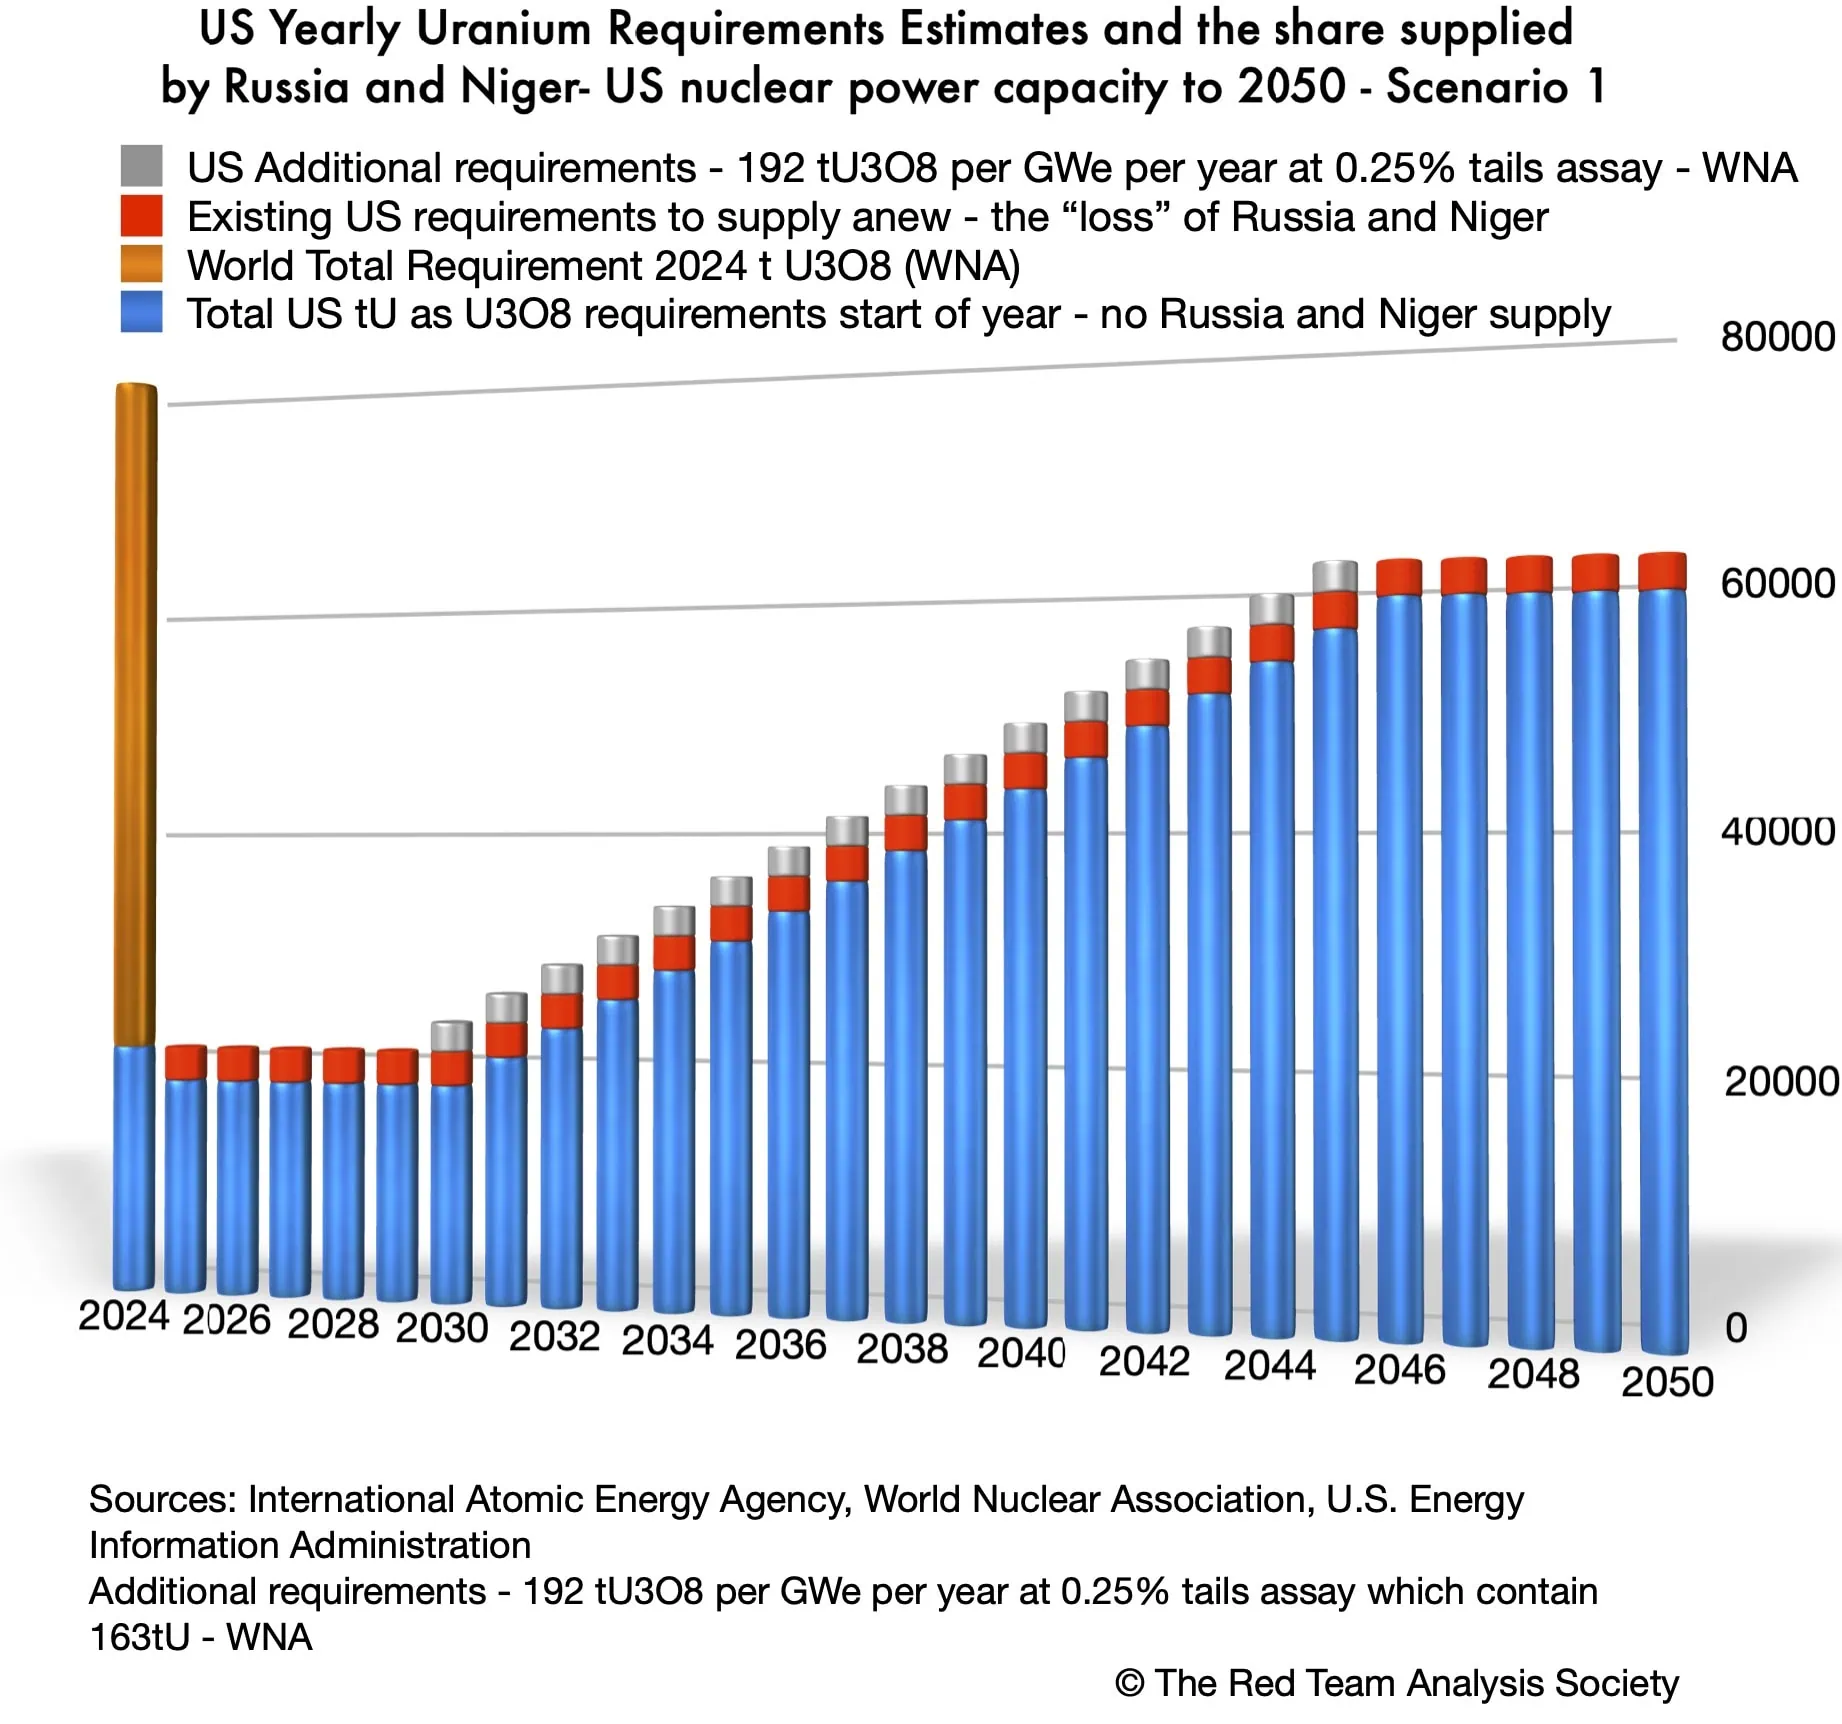
Thus, the way to 300 GW nuclear capacity through steps of 13 GW per year starting in 2030, as planned for scenario 1, corresponds to an increase in uranium requirements of 2.496 tU as U3O8 per year, starting in 2029-2030. As a result, from 2045-2046 onwards, the U.S. will need to increase, yearly, its supply of uranium to reach at least 61.324 tU as U3O8 per year.
What does that represent exactly, beyond having to meet approximately a tripling of uranium requirements?
The first supplementary deliveries under the form of fuel (and not U3O8) will need to take place for 2030. This means that for the deployment of a nuclear reactor in 2030, the whole fuel cycle will have had to take place before the reactor is loaded for the first test programme, which lasts a couple of months, before connection to the grid. Thus, in terms of timing, we need to take into account that the uranium mined and transformed into yellowcake must then go through the stages of conversion, then enrichment, then fuel fabrication to be loaded on time in a nuclear reactor. This also means transportation. As a result, the requirements presented in the chart below correspond to what is needed for a specific year, not to the time of purchase, which should occur beforehand to allow for the complete fuel fabrication cycle to take place.
For scenario 1, the profile of American uranium requirements could look as shown on the chart below:
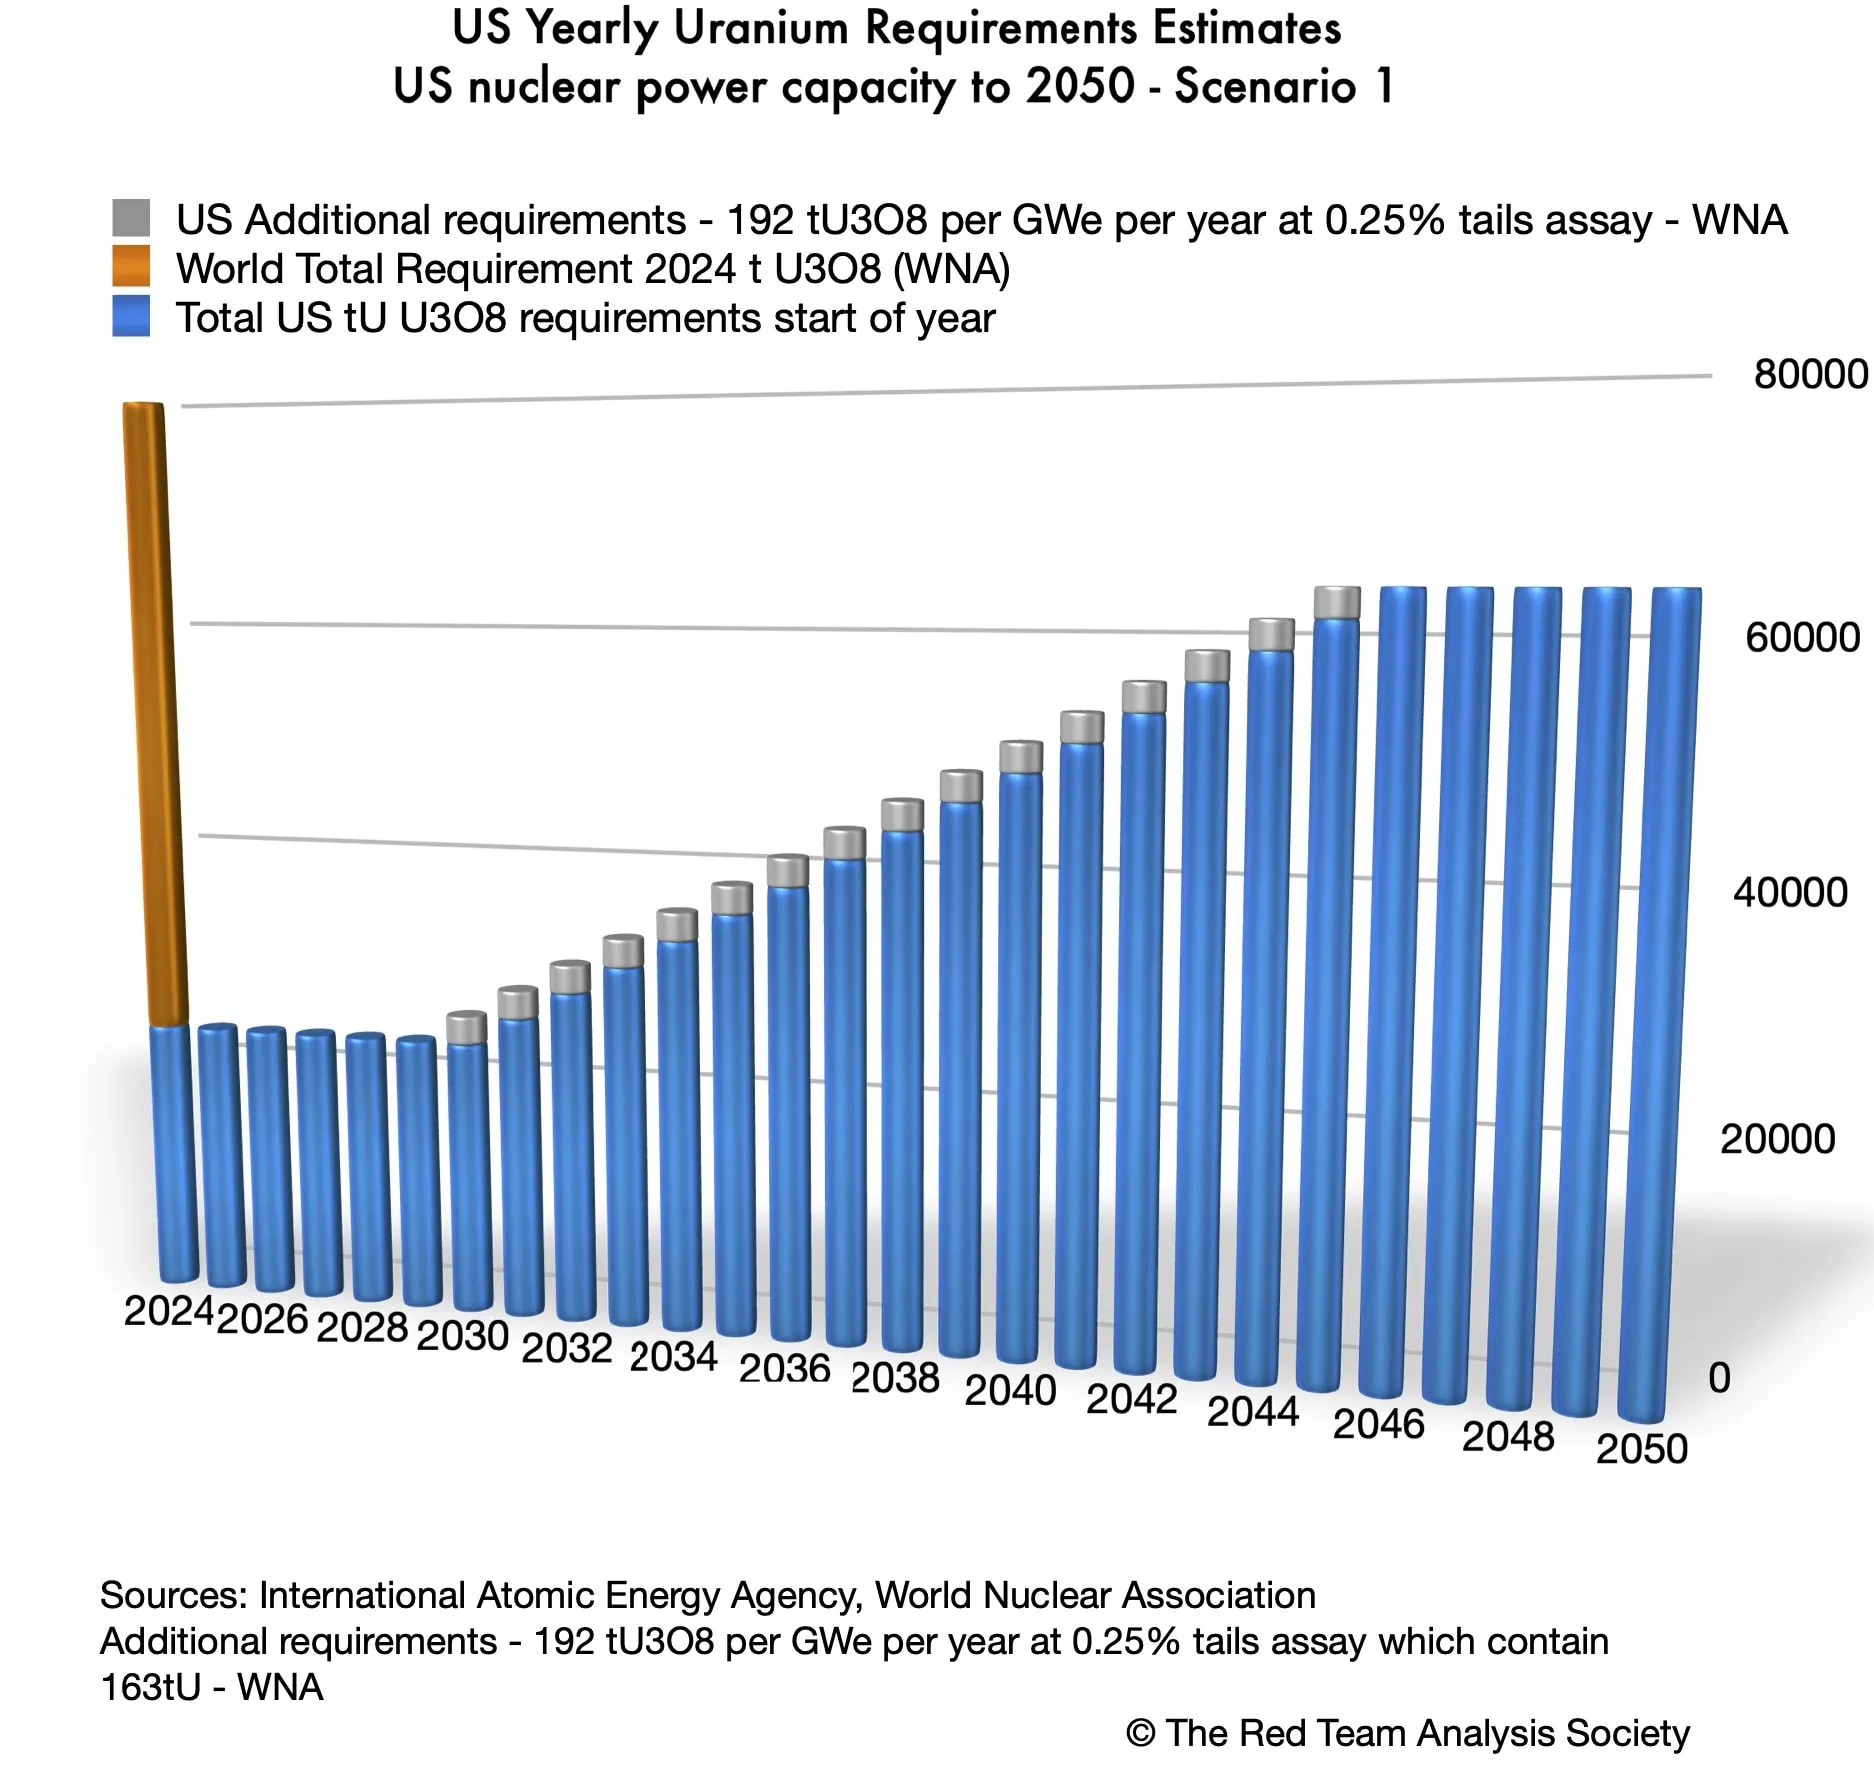
The quantities of uranium that will need to be provided are enormous. From 2045 onwards, they represent approximately 80% of the uranium requirements of the whole world for 2024.
When we compare American uranium requirements to U.S. uranium production, as illustrated in the chart below, the immense challenge of supplying the American Nuclear Renaissance becomes more evident.
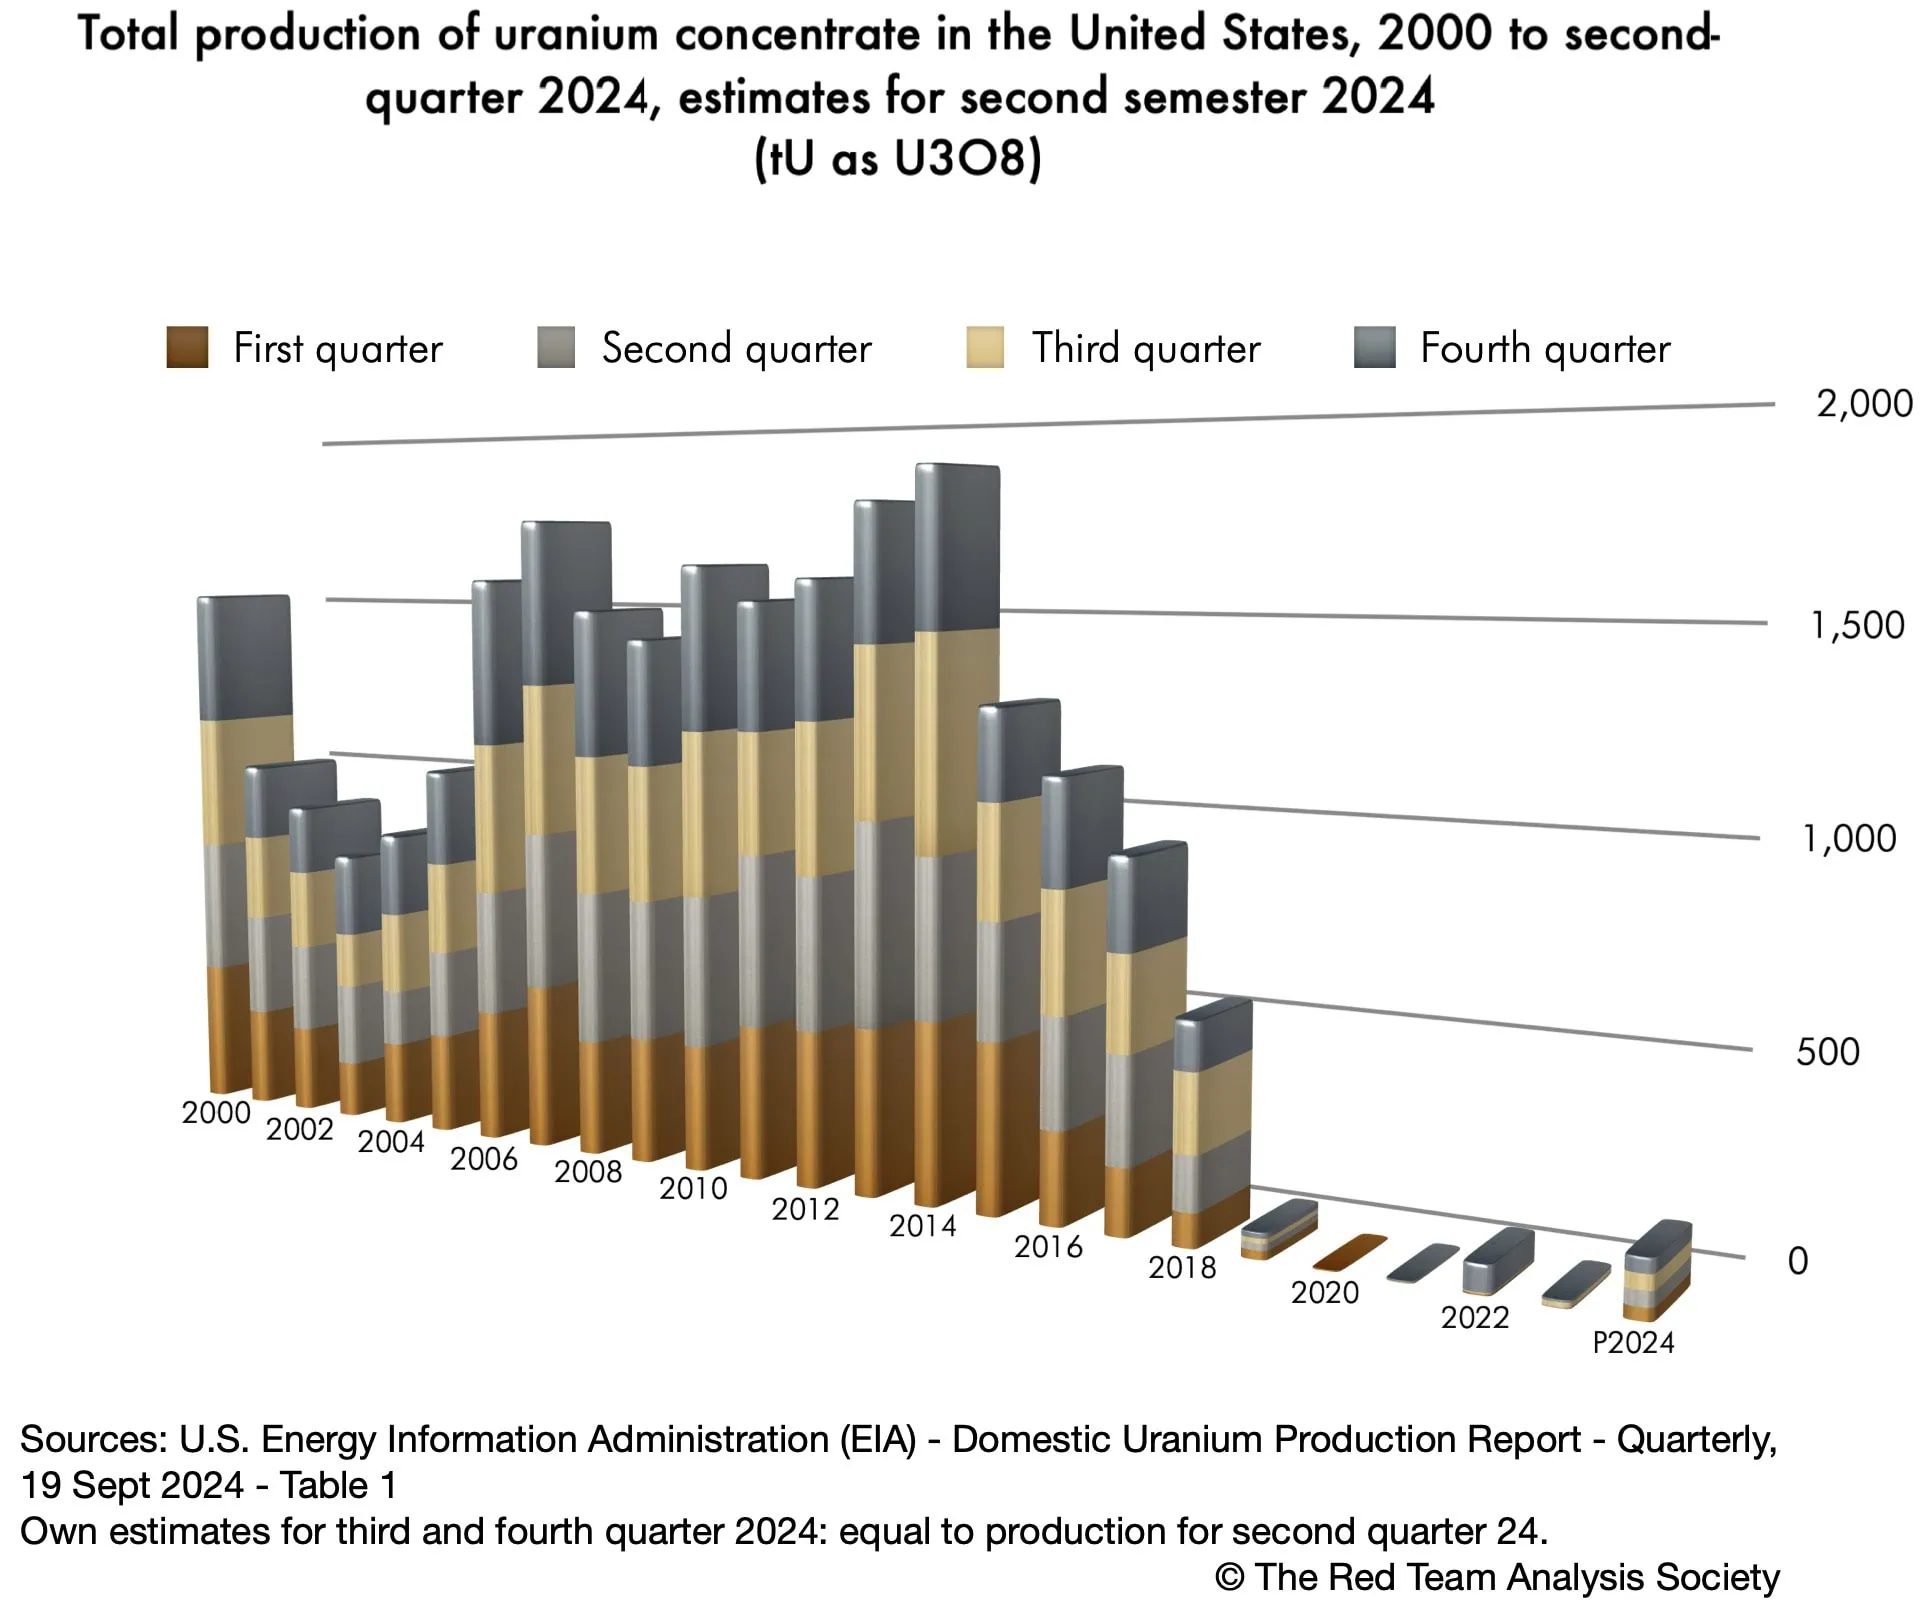
Indeed, at peak in 2014, U.S. uranium production reached 1.881 tU as U3O8 (U.S. Energy Information Administration, Domestic Uranium Production Report, Quarterly 19 Sept 2024, Table 1). Since then it has declined to almost zero with a timid recovery in 2024. Thus, the first supplementary uranium requirement needed for the American nuclear plans already represents 1,33 times the maximum the U.S. has ever been able to produce. Accessorily, the 2014 U.S. peak production is below the 2.000 tU as U3O8 per year of capacity highlighted in the DOE 2024 Pathways (p. 57), to say nothing of the 2019-2024 production.
Currently, without even considering any supplementary nuclear power capacity, the American nuclear requirements represent more than 11 times the U.S. 2014 peak uranium production.
How are the U.S. thus meeting their needs in uranium? Understanding their current uranium supply policy should help us envision how they can meet future needs and the challenges involved.
Purchasing rather than producing uranium
As highlights the DOE, the U.S. “procured ~22.000 MT” (2024 Pathways…, p. 57). This means, obviously, that what the U.S. does not produce domestically is bought elsewhere.
In 2023, the overall amount of uranium delivered to the U.S. was 19.847,8 t U3O8e an increase by 27 % on the 2022 amount. This increase may correspond to the connection to the grid of the Vogtle reactors, or to a lesser use of uranium stored, or both. It represented 93,27% of the U.S. requirements for 2023 (WNA, World Nuclear Power Reactors & Uranium Requirements, Dec 2023).
A reduced American involvement in uranium mining, at home and abroad
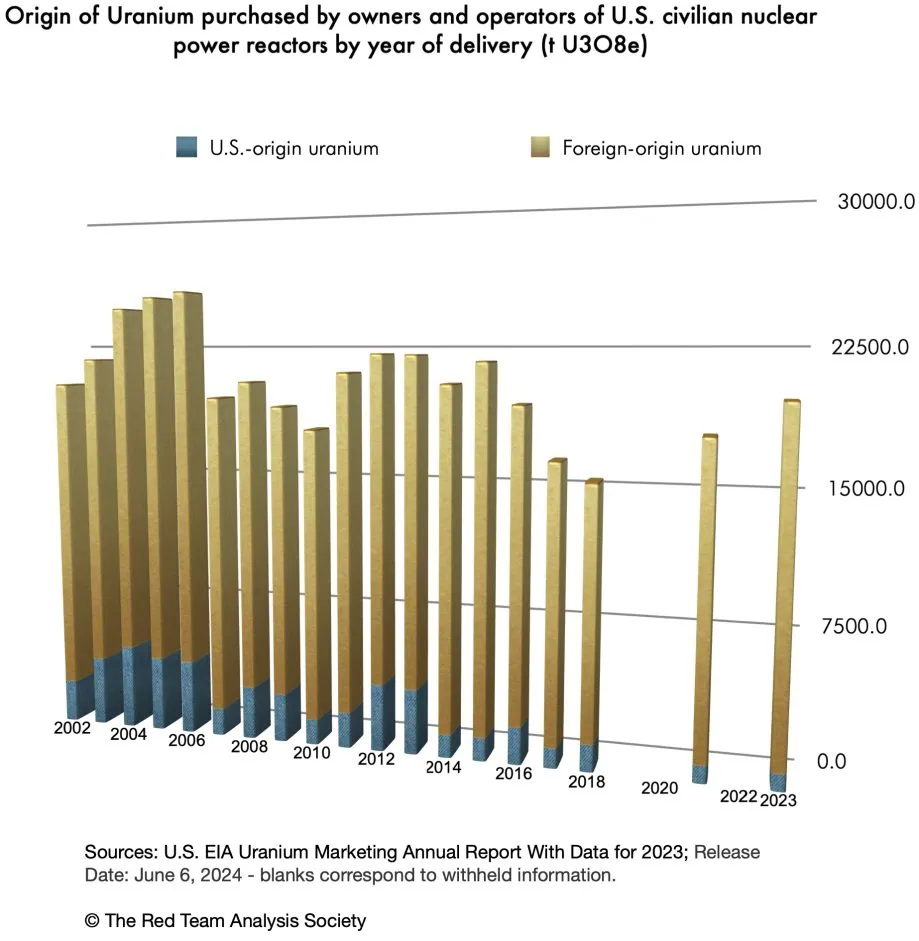
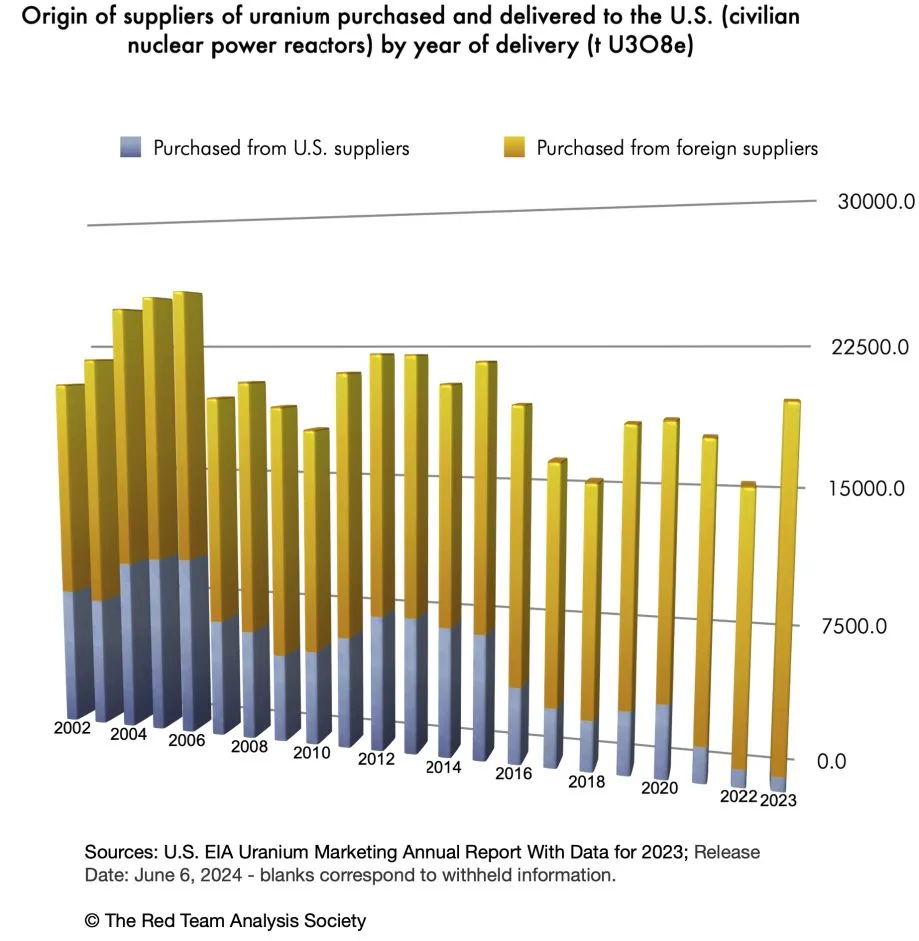
The U.S. faces a double challenge, as revealed by the next two charts.
Insufficient uranium deposits on American territory
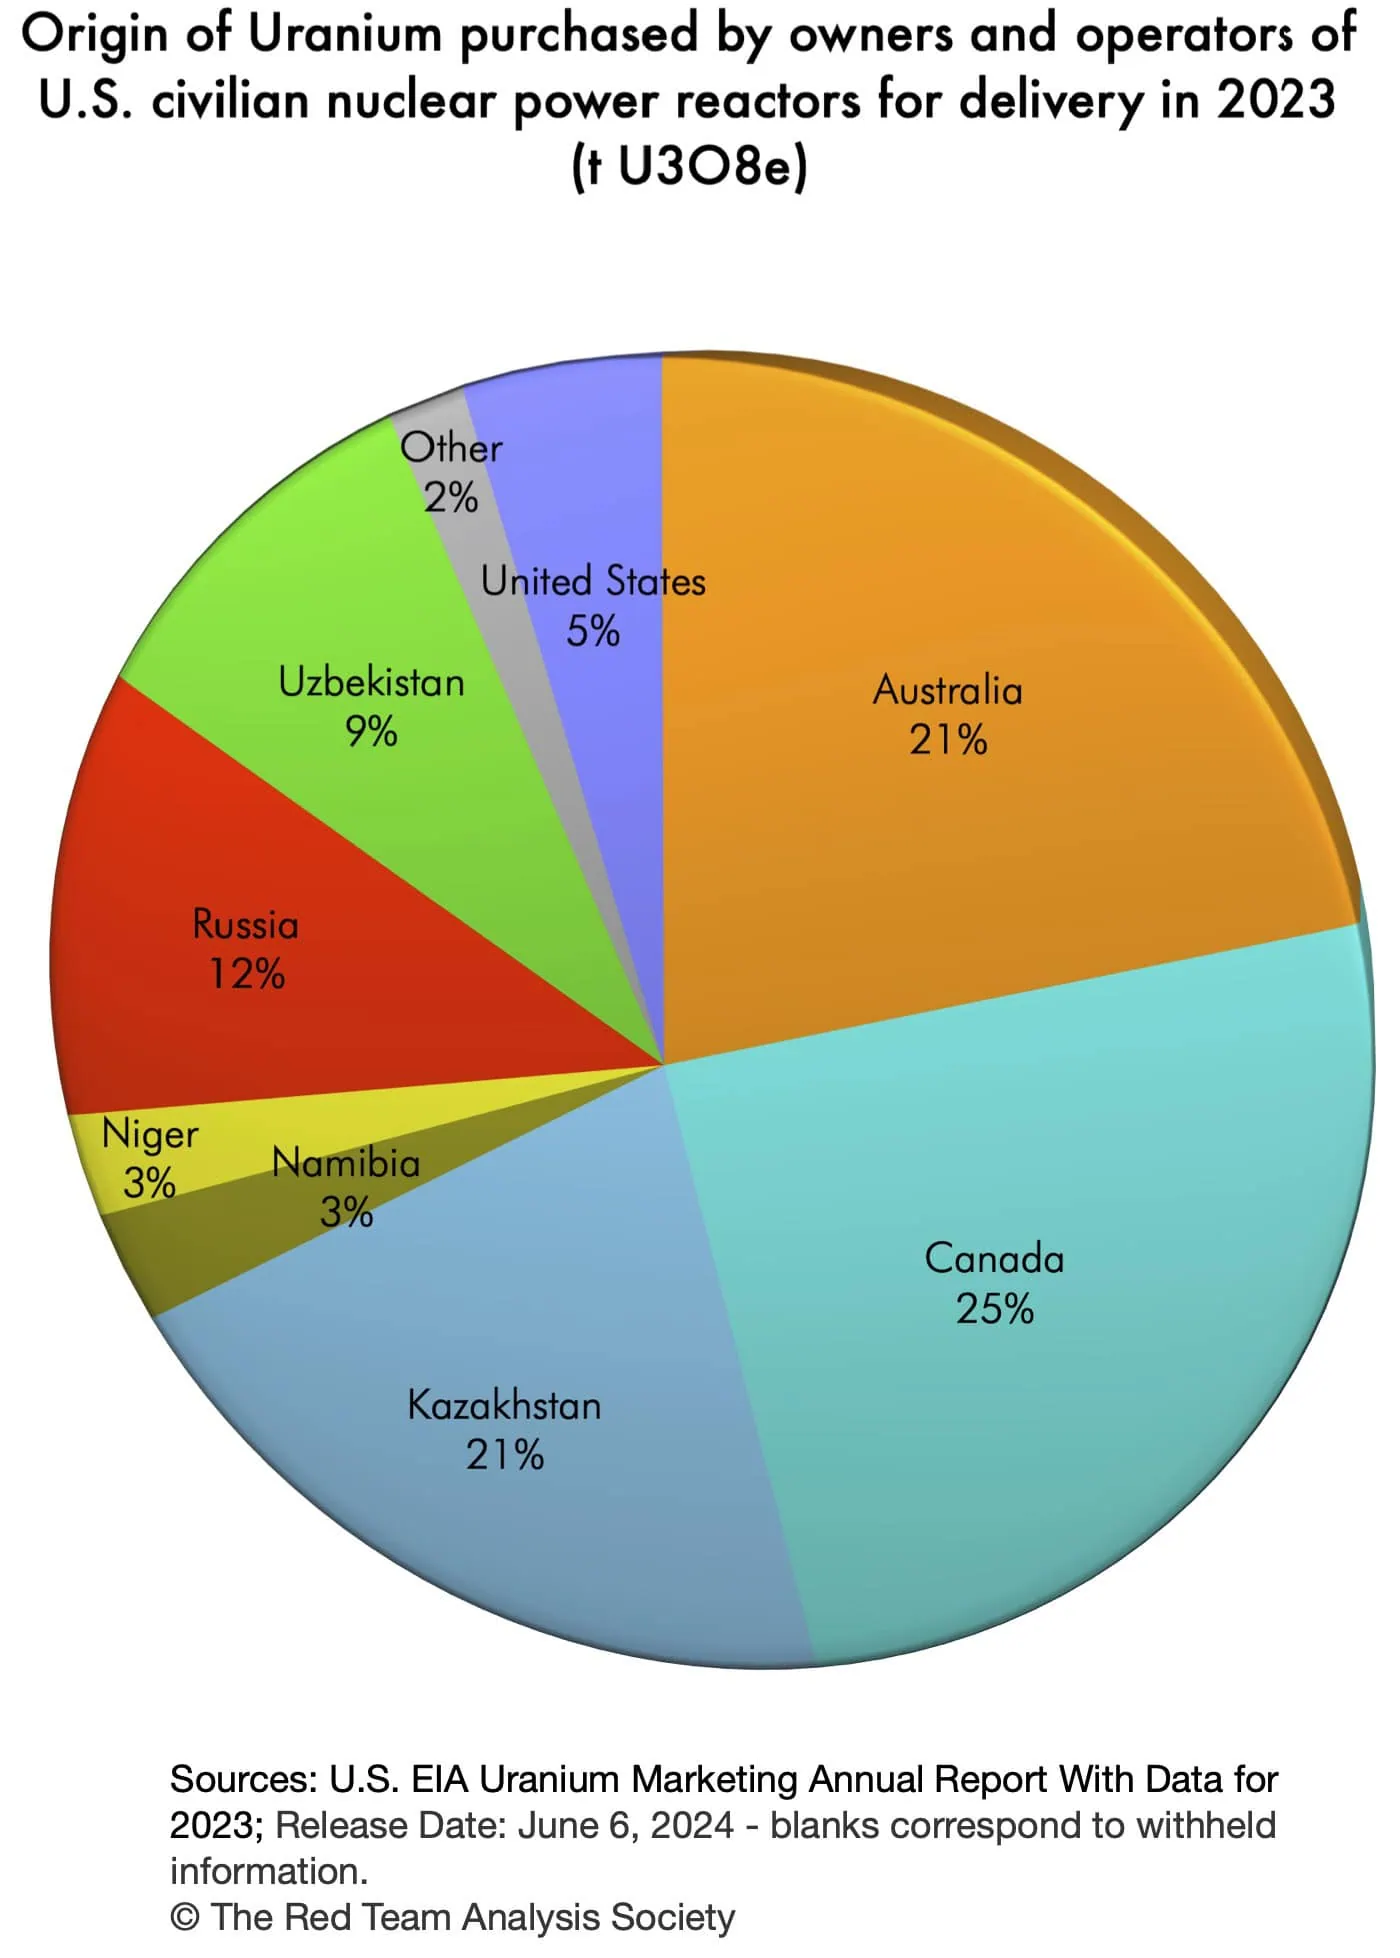
First, as expected from the uranium production figures, only 4,65% of the uranium delivered originated from the U.S., i.e. came from American deposits, whilst 95,35% came for foreign countries (first chart). The American situation compared with the early 2000s worsened, as uranium production has plummeted since 2016.
Indeed, compared with all other uranium producing countries, the U.S. is far from leading in terms of uranium reserves and resources. If we add the reserves and measured and indicated resources of 126 mines worldwide with known such reserves and resources, then the U.S. ranks 12th for the deposits on its geographical territory (see The World of Uranium – 1: Mines, States and Companies – Database and Interactive Graph).
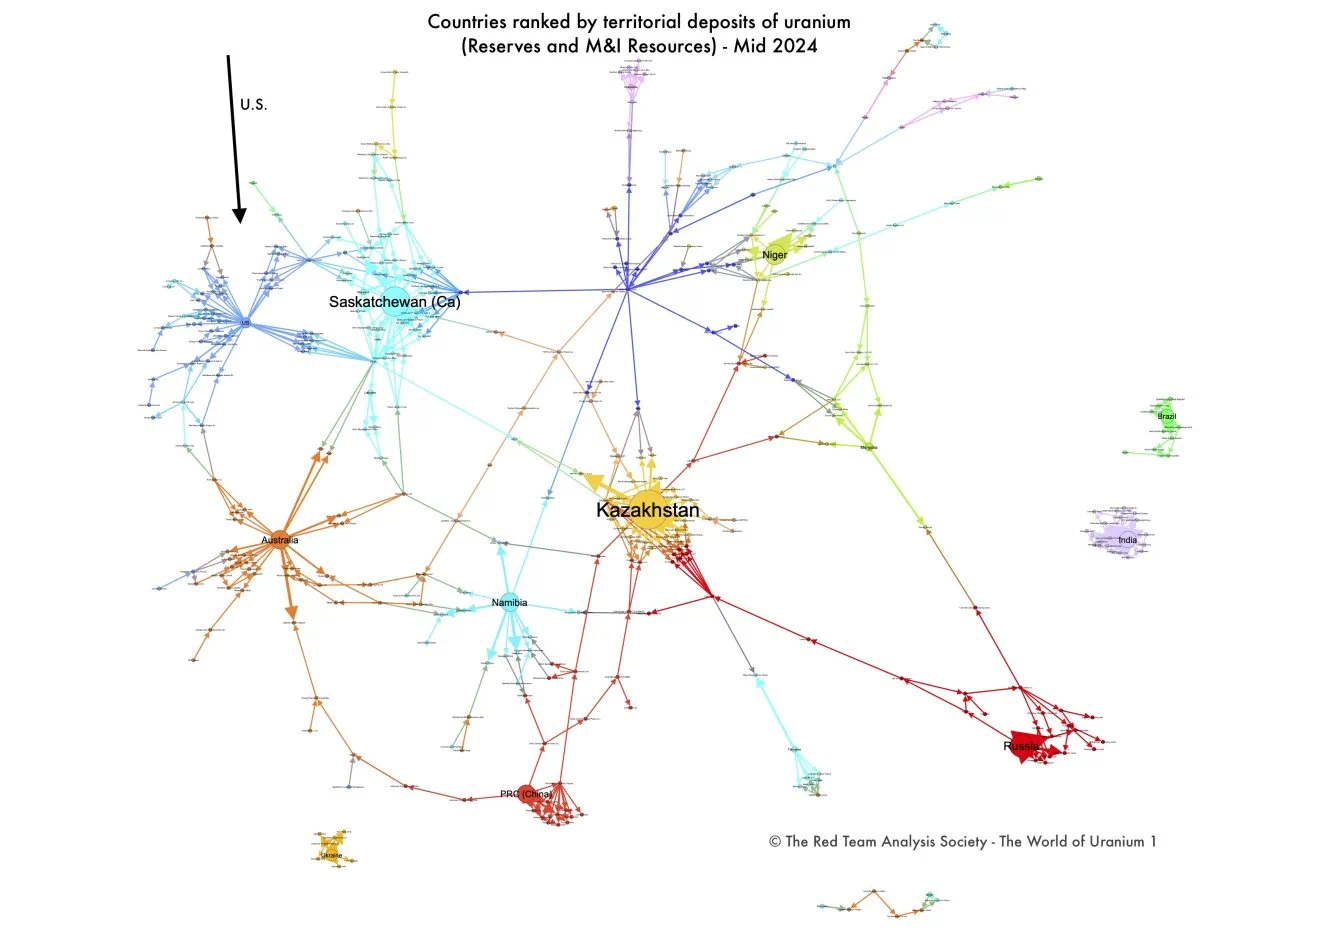
These deposits, when adding all the assessed mines on American territory, amount nonetheless to 147.820 tU as U3O8 (Ibid.). Yet, this corresponds only to 6,77 years of uranium requirements for 2023, and to 2,41 years of uranium requirements from 2045-2046 onwards.
Overwhelming reliance on foreign suppliers
Secondly, only 3.88% of the uranium delivered to the United States was purchased by American suppliers, whilst 96.12% was purchased by foreign suppliers (second chart). The situation, again, has considerably worsened throughout the first two decades of the millenium, showing a disinterest of American companies in uranium.
Moreover, the two charts above together show that not only U.S. domestic production is small, but, it is also partly done by foreign companies, which is confirmed by the graph below (created with the World of Uranium – 2). Indeed Australian and Canadian companies hold shares of American uranium deposits.
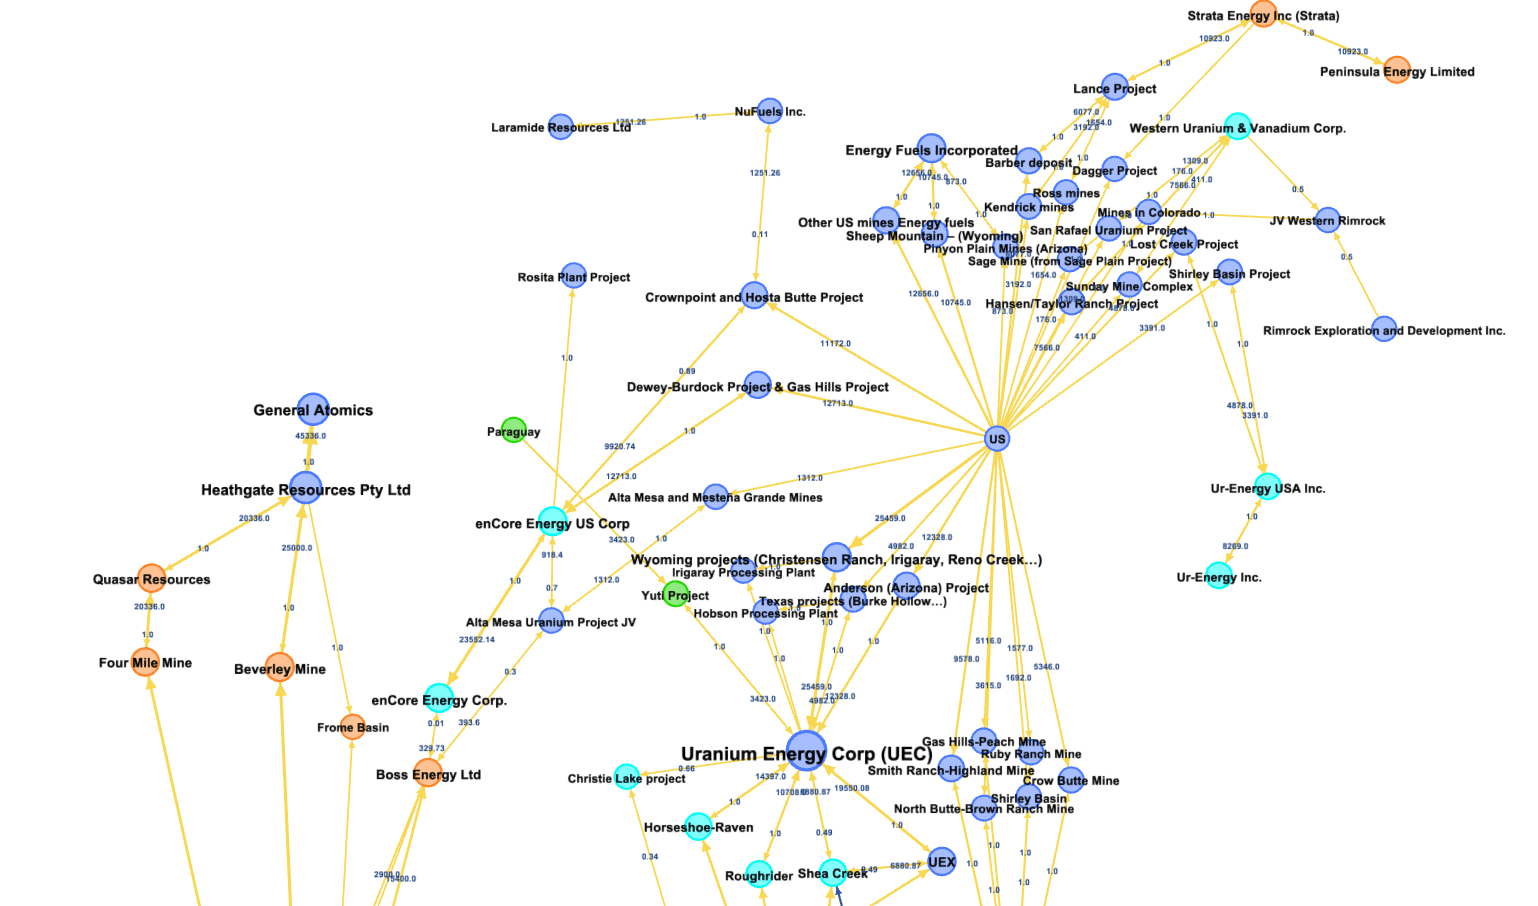
Meanwhile, American mining companies hold, worldwide, relatively few reserves and resources. As they have been little involved overseas, apart from some mines held in Paraguay, Australia and Canada, their share of overseas reserves and resources is relatively not very important (see The World of Uranium – 2: Mines, States, Companies and Shares of Reserves and Resources – Database and Interactive Graph).
Dependence on foreign companies and foreign supply for uranium
As a result, with little production either at home or abroad, the United States relies abundantly on purchase from foreign companies of uranium mined abroad, mainly through long-term contracts (84,08% in 2023) and on the spot market (14,92% in 2023) (U.S. Energy Information Administration, “Table S1a. Uranium purchased by owners and operators of U.S. civilian nuclear power reactors, 2002-2023”, 2023 Uranium Marketing Annual Report, June 2024).
The countries from which the uranium delivered in 2023 was purchased are as shown on the chart below:
As we shall now see this American dependence on foreign uranium and foreign operators fragilise the security of uranium supply of the U.S. in the light of global politics.
When dependence on foreign uranium fragilise the security of uranium supply
Losing Russia and Niger’s uranium?
Assuming the new 2025 Trump administration does not change 2024 policies and does not work its way towards mending relationships with Russia, by 1st January 2028 and the end of the Russian sanctions waiver regime, Russia should not be anymore a source for uranium for the U.S..
Actually, considering the Russian decision to temporarily ban the export of enriched uranium to the U.S., with exceptions according to Russian interests, the necessity for America not to rely on Russian uranium could be far closer in time, if not immediate (Jonathan Tirone, Ari Natter and Will Wade, “Russia takes aim at US nuclear power by throttling uranium“, Mining.com, 15 November 2024).
The need to replace Russian uranium could also last “only” as long as American policy towards Russia does not change, while being a stake among others in possible future changes of relationships between the U.S. and Russia.
It is also likely that in the future, Niger will not either be, for the U.S., a source for uranium, considering international developments (see Hélène Lavoix, Niger: a New Severe Threat for the Future of France’s Nuclear Energy?, The Red Team Analysis Society, 21 June 24; RTI, “Niger embraces Russia for uranium production leaving France out in the cold” 13 November 2024).
Hence, always in the hypothesis of a continuation of the Biden administration’s policy toward Russia by the Trump administration, on top of the future requirements needed for its Nuclear Renaissance, the U.S. may also need to secure yearly 2.869 tU as U3O8 to replace Russian and Nigerien uranium (U.S. Energy Information Administration, “Table 3. Uranium purchased by owners and operators of U.S. civilian nuclear power reactors by origin country and delivery year, 2019–23”, 2023 Uranium Marketing Annual Report, June 2024).
More exactly, suppliers of uranium for American requirements need to secure every year these 2.869 tU as U3O8.
Increasing uranium requirements while shrinking the possible sources of supply
As a result, even though the requirements supplied previously by Russia and Niger are not new, they will nonetheless have to be met in a new way. It is thus 2.869 tU as U3O8 yearly the U.S. has to procure newly until 2029, to which will be added then the supplementary 2.867 tU as U3O8 each year, corresponding to the added nuclear capacity of scenario 1. Thus, on the one hand requirements have increased, while on the other hand the available supply has shrank as Russian and Nigerien deposits are not anymore available, until conditions and policies change.
The American requirements, which thus have to be supplied, are shown on the chart below:
To illustrate the purchases the U.S. would have to make to supply these new American uranium needs for Scenario 1, we may separate certain requirements – those that were supplied by Russia and Niger – from possible ones, stemming from the plans for the nuclear renaissance.
Replacing uranium from Russia and Niger
The yearly 2.869 tU as U3O8 requirements that were previously supplied by Russia and Niger, may now come from the increase in production planned by Canadian Cameco and French Orano for their plants of Cigar Lake(3) and McArthur River/Key Lake(4) (for more on these companies see, Helene Lavoix, “Revisiting Uranium Supply Security (1), The unique world of those who mine uranium“, The Red Team Analysis Society, 21 May 2024). If we look for these plants at the production for 2023 and compare it with the expected production for 2024, the increase in production for the two sites corresponds to 2.847 t U as U3O8, which is approximately what is needed to cover the American needs to replace Russia and Niger. In this hypothesis, we imagine that the partners for the two mines and mills sell all the supplementary production to the U.S..
| Cigar Lake / McLean Lake mill Mlbs | tU as U3O8 | McArthur River / Key Lake mill Mlbs | tU as U3O8 | Total Mlbs | tU as U3O8 | Increase | |
|---|---|---|---|---|---|---|---|
| 2023 | 15.1 | 5808.17 | 13.5 | 5192.73 | 28.6 | 11000 | |
| 2024 | 18 | 6923.65 | 18 | 6923.65 | 36 | 13847 | 2847 |
| Max capacity | 18 | 6923.65 | 25 | 9616.17 | |||
| Remaining mine life (years) | 13 | 16 | |||||
| End of production – (approx.) | 2037 | 2040 @18 Mlbs/year |
In 2038 and 2041, however, these mines will have reached the end of their lives and other sources of supply will have to be found.
Meanwhile, as we shall see in the next article, where we shall consider the impact of the American uranium requirements on the global uranium stage and then feedback on uranium supply, not all production of these mines may be sold to the U.S.. In that case, some American nuclear utilities would have to find elsewhere other sources of supply. At worst they could be left without enough uranium to power their reactors, which could mean electricity shortages.
Procuring for the new uranium requirements of the American nuclear renaissance
The main existing producing mines and mills of Canada have already been used in our hypothesis to replace Russian and Nigerien uranium (Canadian Nuclear Safety Commission, Operating uranium mines and mills – Rabbit Lake is currently under safe state of care and maintenance and 14.847 tU of indicated resources remain).
The U.S. will thus need to procure uranium elsewhere. This demands starting operations in new mines, as we shall see with the next article.
Now, each year, the new supplementary needs of the U.S. stemming from scenario 1 would represent the equivalent to between 10.6% and 11% of the entire 2024 Kazakh production, which should reach between 22.500 and 23.500 tU (update to 2024 production guidance, “Kazatomprom 1H24 Financial Results and 2025 Production Plan Update“, 23 August 2024). Kazakhstan is the first producer of uranium in the world.
This means that for 2030 the U.S. would need the equivalent to 10.6% to 11% of the Kazakh production. Then for 2031 it would need another 10.6% to 11%, thus it would absorb the equivalent to between 21.2% and 22% of the Kazakh production. For 2032 it would again need another 10.6% to 11%, thus would absorb the equivalent to between 31.8% and 33% of the Kazakh production, etc.
From 2045 onwards each year, considering the entirety of American requirements, the U.S. would swallow the equivalent of almost thrice the entire 2024 Kazakh production. The U.S. will thus have to “find three Kazakhstan” every year for ever or for as long as its nuclear energy capacity remains at 300 GWe.
These are unprecedented quantities.
Now, uranium mining, production, and trade are activities taking place at a global level: actions at one end of the planet by one player impact the whole uranium playing field, which in turn has consequences for each and every actor. Thus, before to look at options available to the U.S. we must first contextualise globally American uranium requirements: Uranium for the U.S. Nuclear Renaissance – 2: Towards a global geopolitical race.
Notes
(1) Advanced nuclear reactors include Generation III (Gen III), Generation III+ (Gen III+) and Generation IV (Gen IV) reactors (see for example, WNA, “Advanced Nuclear Power Reactors“, April 2021).
(2) These estimated requirements in uranium are a minimum. Indeed, if a reactor of an older technology is recommissioned, as is likely to be the case, then uranium requirements will be higher (for a rapid summary regarding the generations (GEN) of reactors and recommissioning, Lavoix “Towards a U.S. Nuclear Renaissance?“).
(3) Cigar Lake is owned at 54.547% by Cameco, 40.453% by Orano Canada Inc. (Orano) and 5% by TEPCO Resources Inc.
(4) The Key Lake mill is owned 83.333% by Cameco and 16.667% by Orano.


Leave a comment