(Art direction and design: Jean-Dominique Lavoix-Carli)
In December 2023, twenty two governments and the nuclear industry decided to treble nuclear energy by 2050. If we are to meet this objective, then the corresponding uranium supply must be adequate.
Globally, there is enough uranium to see the aims met (see Uranium and the Renewal of Nuclear Energy). Now, each country must also have sufficient uranium supply in a timely manner, according to its plans to develop nuclear energy (The Future of Uranium Demand – China’s Surge).
- Fifth Year of Advanced Training in Early Warning Systems & Indicators – ESFSI of Tunisia

- Towards a U.S. Nuclear Renaissance?

- AI at War (3) – Hyperwar in the Middle east

- AI at War (2) – Preparing for the US-China War?

- Niger: a New Severe Threat for the Future of France’s Nuclear Energy?
- Revisiting Uranium Supply Security (1)
- The Future of Uranium Demand – China’s Surge
We thus need to assess the present and future supply of each country, in the light of its current and planned future needs, in a political and geopolitical environment which is not anymore peaceful, as has been known since the end of the Cold War, but, on the contrary, increasingly tense and fraught with hostility.
In this article, we focus on assessing the potential supply available per country. First, we present a classical approach which is related to the producer versus consumer countries’ vision. To better understand the tensions that may be generated between countries, we add a third variable to this classical approach indicating the importance of uranium supply for each country.
Second, we explain, that, to understand what may happen in terms of supply of uranium, notably as far as politics and geopolitics are concerned, we need to consider the actors involved in uranium supply, i.e. not only countries but also and foremost uranium mining companies. We thus present the mining actors.
Finally, building upon the two first parts, we obtain a revisited outlook for uranium reserves and resources per country, including also uranium overseas holdings. This perspective offers a better comprehension of uranium supply security. It allows for better strategy and planning, including in terms of foreign relations, influence and future feedback impacts on domestic politics. Those should be of concern to all actors involved in the nuclear industry field.
A classical vision of uranium supply
When assessing the security of supply of uranium for a country, as resulting from the classical producers versus consumers model, we look at reserves and resources of uranium per country. Those are estimated according to the quantity of uranium in the mines that can be recovered in line with the price of uranium, and to the precision and certainty of knowledge one has about the deposit of uranium (e.g. Nuclear Energy Agency (NEA)/International Atomic Energy Agency (IAEA), Uranium 2022: Resources, Production and Demand (Red Book), OECD Publishing, Paris, 2023; for the producer versus consumer model, see, for example, pp. 99-136).
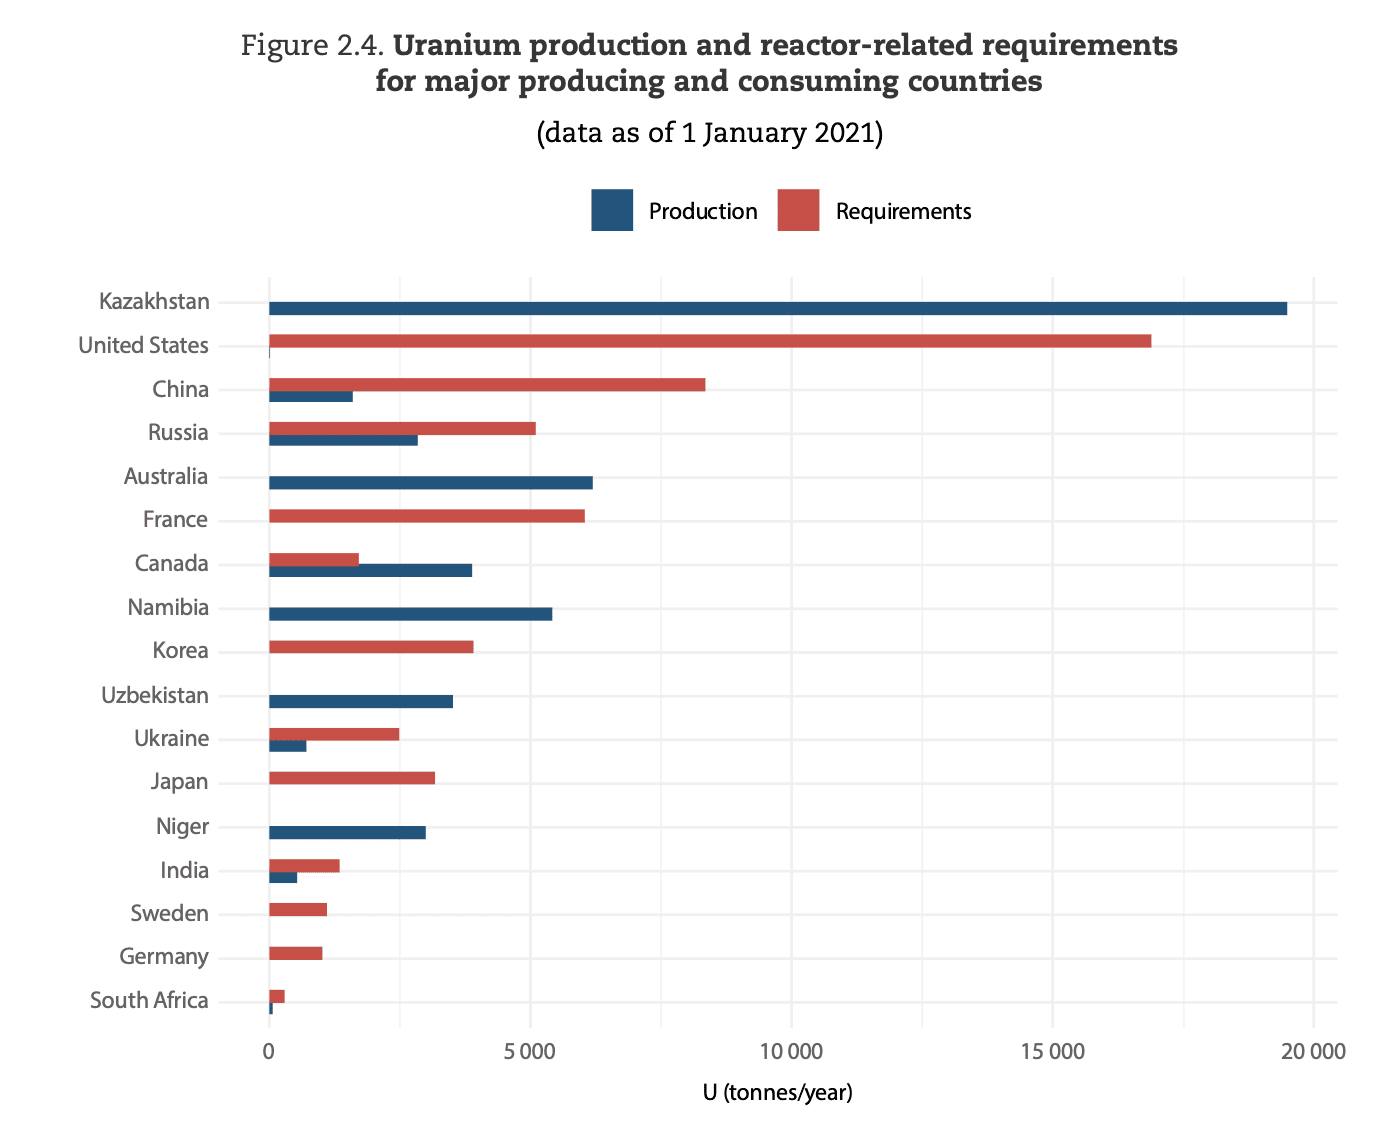
Using the official international reference for uranium production, Uranium 2022: Resources, Production and Demand (Red Book) by the NEA/IAEA, this gives us, for the resources which are most certain, those called “Reasonably Assured Resources (RAR)” (see glossary below), at the highest price range, the following chart:
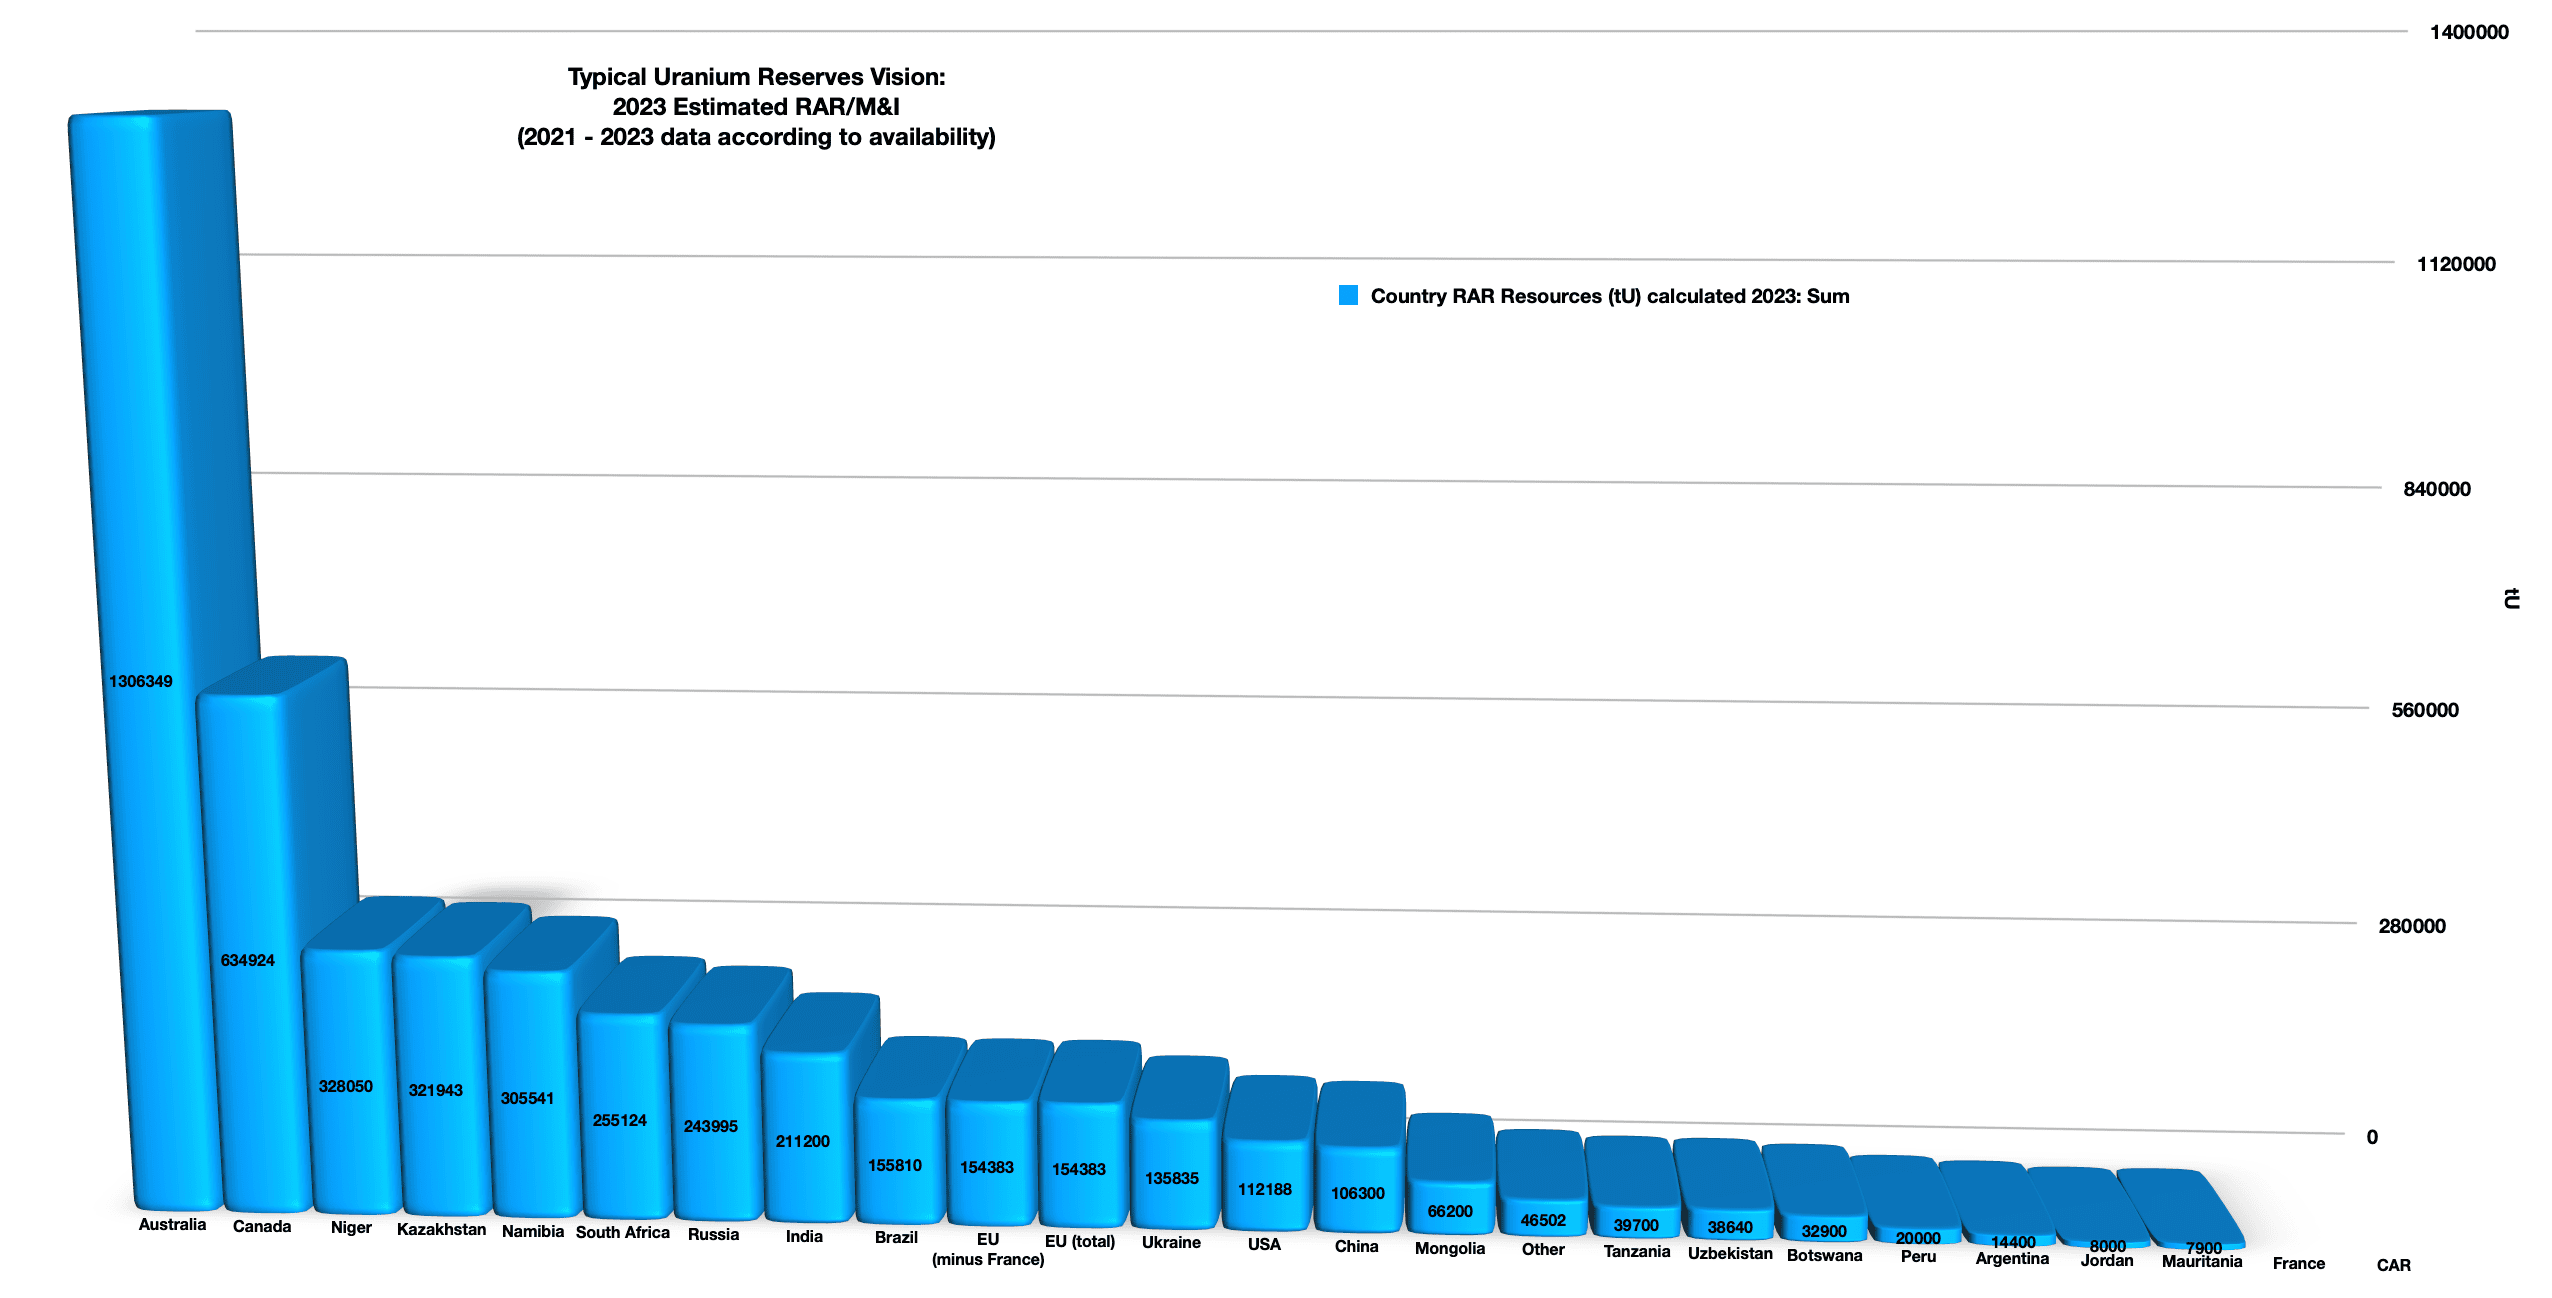
Then, those resources are then compared with countries’ yearly uranium requirements. As a result, some states are perceived as current and future importers, while others are exporters.
For example, Australia does not use nuclear energy, indeed the latter is legally prohibited despite regular debates on the issue (Commonwealth Scientific and Industrial Research Organisation – CSIRO, “The question of nuclear in Australia’s energy sector“, 20 Dec 2023). Yet, the country produces uranium and has huge reserves, the first in the world. Hence, Australia was the second largest world exporter in 2020 and the fourth in 2021 and 2022 (2022 Red Book, pp. 77; WNA, “World Uranium Mining Production“, 16 May 2024). It is also very likely it will be a future very large net exporter, possibly the largest.
At the other end of the spectrum, France does not have any resources of uranium left on its territory. Yet, it is part of the major nuclear energy producers, indeed it is currently the 2nd in the world. In the future, according to our base case scenario it should move to the 3rd then 4th place (see Helene Lavoix, The Future of Uranium Demand – China’s Surge, The Red Team Analysis Society, 22 April 2024). As a result, currently, producing nuclear energy in France would require an estimated 8232 tU per year (WNA, Nuclear Fuel Report 2023, September 2023). In the classical view, France is thus a current and future net consumer of uranium. The only way forward to improve the situation would be technical, for example with fuel recycling.
If we are concerned about security, then we can improve this approach by looking at the importance of nuclear energy for a country. The most interesting indicator here is the share of nuclear energy in the electricity production of a country. Indeed, for example, if nuclear energy represents 1% of the electricity production of a country, then not much is at stake here. The higher the nuclear share of electricity generation, the higher the stake for all issues related to nuclear energy. For 2022, the shares of nuclear energy in electricity generation for the world are shown in the chart below (source IAEA-PRIS – 28/04/2024).
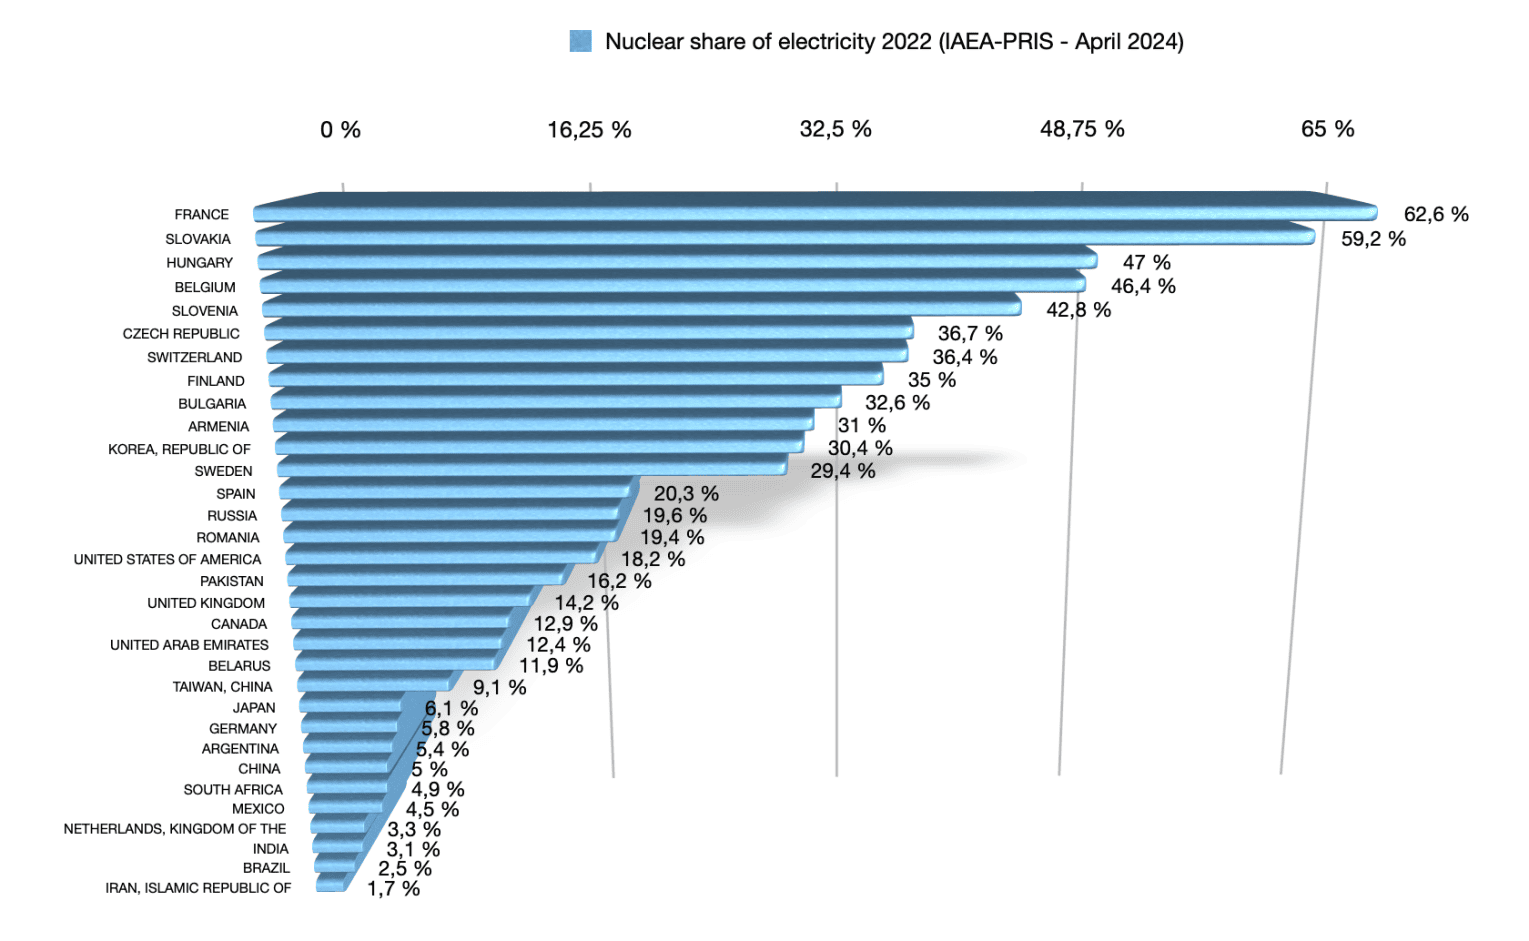
Thus, in 2022, France, had the world highest nuclear share of electricity generation, i.e. 62,6% (IAEA-PRIS – 28/04/2024), while being, according to classical analysis, a net current and future consumer of uranium. Uranium and more largely the whole nuclear industry will thus be highly sensitive issues in terms of security.
If we apply this approach to the world countries, we have the following two charts. The first uses a linear scale for the axes, and the second a logarithmic scale:
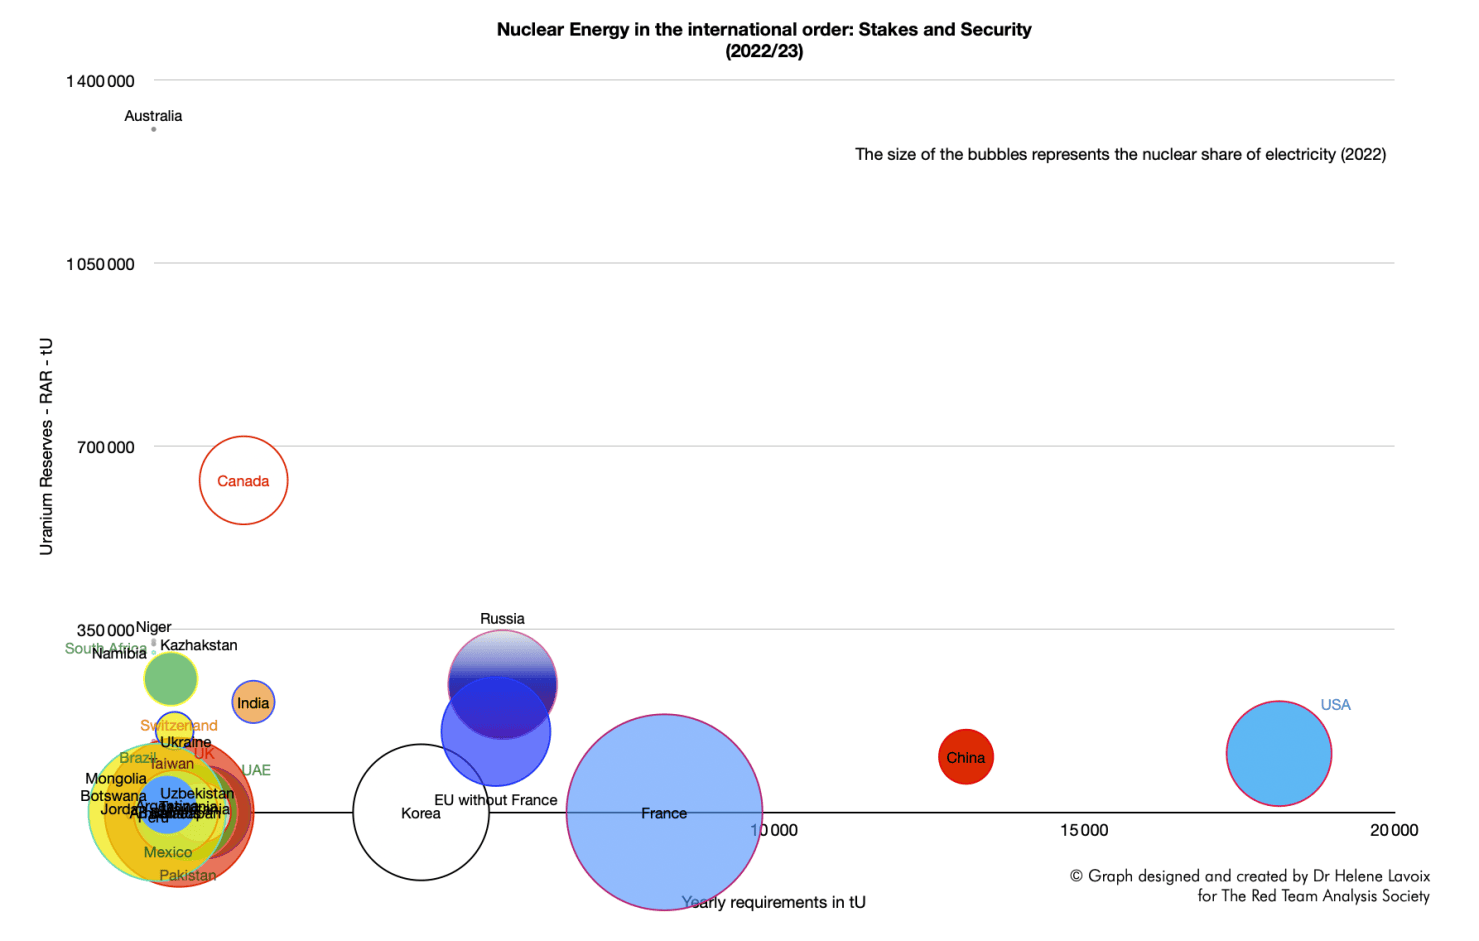
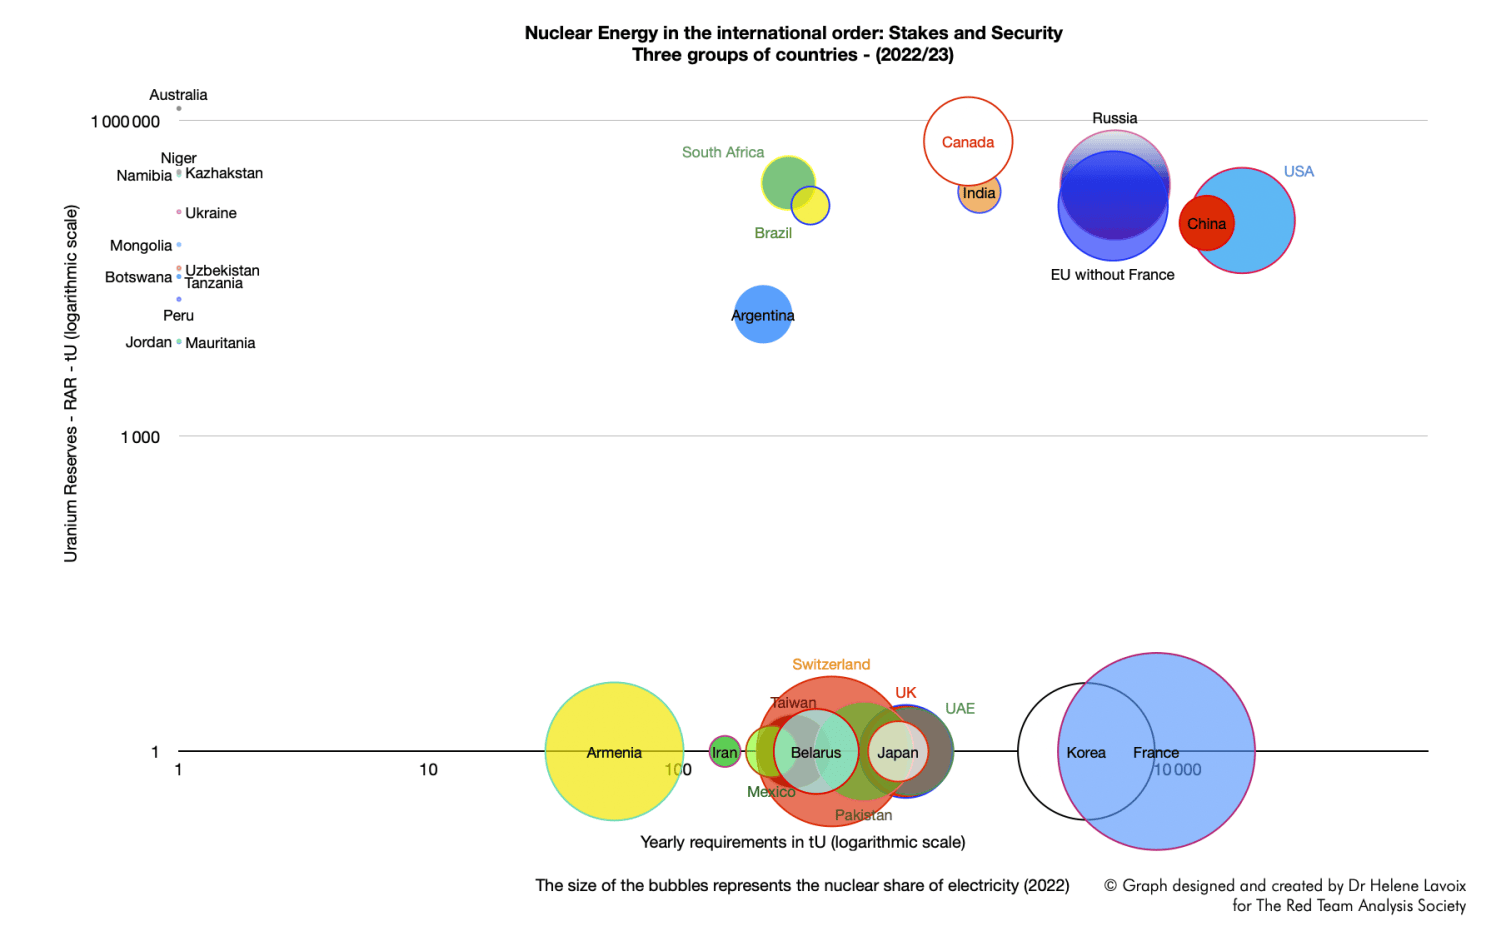
The first chart highlights varying situations. The U.S. is the largest consumer with little reserves but a relatively high stake in nuclear energy, compared with China, which is in a similar situation but with a lower current stake in nuclear energy. This means that China’s position is stronger. Russia, the EU without France, France and Korea constitute a second group, with Russia and the EU without France far better positioned in terms of reserves. Canada has a balanced and secure position, and Australia is possibly unconcerned despite its huge reserves.
Interestingly, three groups of countries clearly appear when we use a logarithmic scale. First, we have consumer countries for which nuclear energy represents a high or relatively high stake at the bottom of the chart. Then we have supplier countries for which nuclear energy is not a stake – of course not considering the importance of uranium in terms of trade – at the top left corner of the chart. Finally, we have countries for which nuclear energy is a stake but with a relatively secure position in the top right quarter of the chart.
We note that the EU without France appears to have a better and more secure position than France, and is on a par with Russia. If Russia’s reserves are higher, nuclear energy is also more important for Russia.
However interesting, it would be misleading to stop here. Indeed, such a classical approach does not account for the way uranium is supplied. It does not consider the actors involved in mining.(1)
The unique world of those who mine uranium
Uranium is supplied to the world through mining and milling, which is done by companies. A few major mining companies dominate the world, alongside large entities part of very large nuclear groups and, finally, smaller mining companies.
These companies are either state-owned or private. Most often they will work through the creation of joint-ventures with other companies, one of them bringing in the mines, which belongs to the territory of its state, the other its know-how and technology in terms of exploration, mining, milling and sometimes also other steps of the fuel cycle (see H Lavoix, “Uranium and the Renewal of Nuclear Energy“, The Red Team Analysis Society, 9 April 2024).
As a result, mining companies own mines or part of them for the duration of the corresponding mining permit, and thus the uranium reserves and resources corresponding to these mines.
If we look at the consequences for a country, we can consider that the supply of uranium, including reserves, may be territorial or extraterritorial. It is territorial if the mines are located on its own territory. This is the classical and obvious understanding. However, it can also be extraterritorial if a company of the nationality of the country owns mining permits outside the country. The stronger the power of the said country over the company, the stronger the fact that uranium may be considered as a captive extraterritorial resource, by opposition to a resource available to all through market dynamics.
Three types of uranium mining companies
We have three types of mining companies.
First, we have very large ones, with western-style corporate structure.
Then, we have “smaller” mining companies compared with the previous type, but which are part of very large nuclear conglomerates, reminding somehow of the old Kombinat (Комбинат) model. Furthermore, the new Kombinats also include the use of financial incentives and cooperation packages in their operations. This is more or less the format for Russia and China.
On another note, the French company Orano is a state-owned company with many activities related to the whole nuclear fuel cycle, and with privileged links with other state-owned companies such as EDF (electricity provider) and Framatome (design and provision of equipment, services and fuel for nuclear power plants – 80,5% belongs to EDF), to say nothing of the Commissariat à l’énergie atomique et aux énergies alternatives (CEA) (French state-owned organisation for research and innovation notably in energy). Thus it could be perceived as a middle way between or a synthesis of a Western corporation and a Kombinat. The recent purchase of shares of Westinghouse by Cameco (see below) highlights the interest of and in this approach.
Together, the companies belonging to these two categories – the western-style corporate structure and the Kombinat – are the major corporate actors for uranium mining. In the world, we only have seven of those.
Finally, we have much smaller companies, usually labelled as “junior mining companies”, often centred around a mine or project. Junior companies can also be held by bigger corporations, which, potentially could give them the power to develop. They may also become stakes in friendly or hostile takeovers.
It is difficult to rank mining companies as they have different activities and publish different data. Nonetheless, if we take uranium mining revenue for 2023 as main indicator, then the largest uranium mining company is Kazakh Kazatomprom, followed by Canadian Cameco then French Orano.
The revenues related to uranium mining from Russia or from China appear as being far smaller, yet important. However, where figures are available, they are probably not comparable. Then, we mention Uzbekistan although there is no specific data for uranium mining revenues.
If we look at uranium production per company and country in 2022 (see WNA, “World Uranium Mining Production“, 16 May 2024), we have the same ranking for the three largest mining companies, followed by China’s CGN – 4th – and CNNC – 7th, by Russia’s Uranium One – 5th – and ARMZ – 9th, by Uzbek Navoi – 6th, Australian BHP – 8th, and American General Atomics/Quasar – 10th. Quasar’s production represents 15% of Kazatomprom’s.
The largest uranium mining companies, “Western-style”
Kazatomprom (Kazakhstan)
National Atomic Company (NAC) Kazatomprom, created in 1997, is the national company of Kazakhstan, responsible for everything related to the nuclear industry, as well as rare metals. In 2018, a strategy of privatisation of NAC Kazatomprom was launched. In 2024, Kazakhstan’s National Wealth Fund, Samruk-Kazyna holds 75% of Kazatomprom, the remaining shares being traded on the London Stock Exchange and the Astana International Stock Exchange. Kazatomprom covers the whole nuclear fuel cycle through joint ventures with other companies.
In 2022, uranium mining represented 85% of the revenues of the company and in 2023 82% (2023 annual report p.47). Kazatomprom, in 2022, represented 22% of the mining market, with 11.373t U3O8 produced and, in 2023, 20% of the mining market with 11.169t U3O8 produced (Ibid. pp. 7-10). Its 2022 revenues amounted to KZT (Kazakhstani Tenge) 1.001.171 million ( USD 2.248,16 million ; EUR 2.109,35 million) and in 2023 KZT 1.434.635 million (USD 3.233,24 million ; EUR 3.001,77 million)(Ibid.).
Cameco (Canada / Saskatchewan)
Cameco is a privately-owned Canadian company. More exactly, it is a “privately-owned” company from Saskatchewan, with land-holdings and exploration permits located in majority in Northern Saskatchewan for their Canadian part. When Cameco was created in 1988, a special type of shares, “share B” were issued, “assigned $1 of share capital, [which] entitles the shareholder to vote separately as a class in respect of any proposal to locate the head office of Cameco to a place not in the province of Saskatchewan” (p. 147). This shows the very strong link between Cameco and the province of Saskatchewan, even though it is indeed privately-owned.
Furthermore, Crown Investments Corporation is the holding company used by the Government of Saskatchewan to manage its financial and commercial Crown Corporations as well as its minority holdings in private-sector ventures. Crown Investments Corporation holds 0,15% of the capital of Cameco. Meanwhile, Cameco’s President and Chief Executive Officer, Tim S. Gitzel, comes from the university of Saskatchewan (and has also held direction positions with Orano).
Cameco’s activity covers the entire front-end of the nuclear fuel cycle, from exploration, mining and milling to fuel manufacturing through conversion and is part to the development of laser enrichment (not yet commercialised).
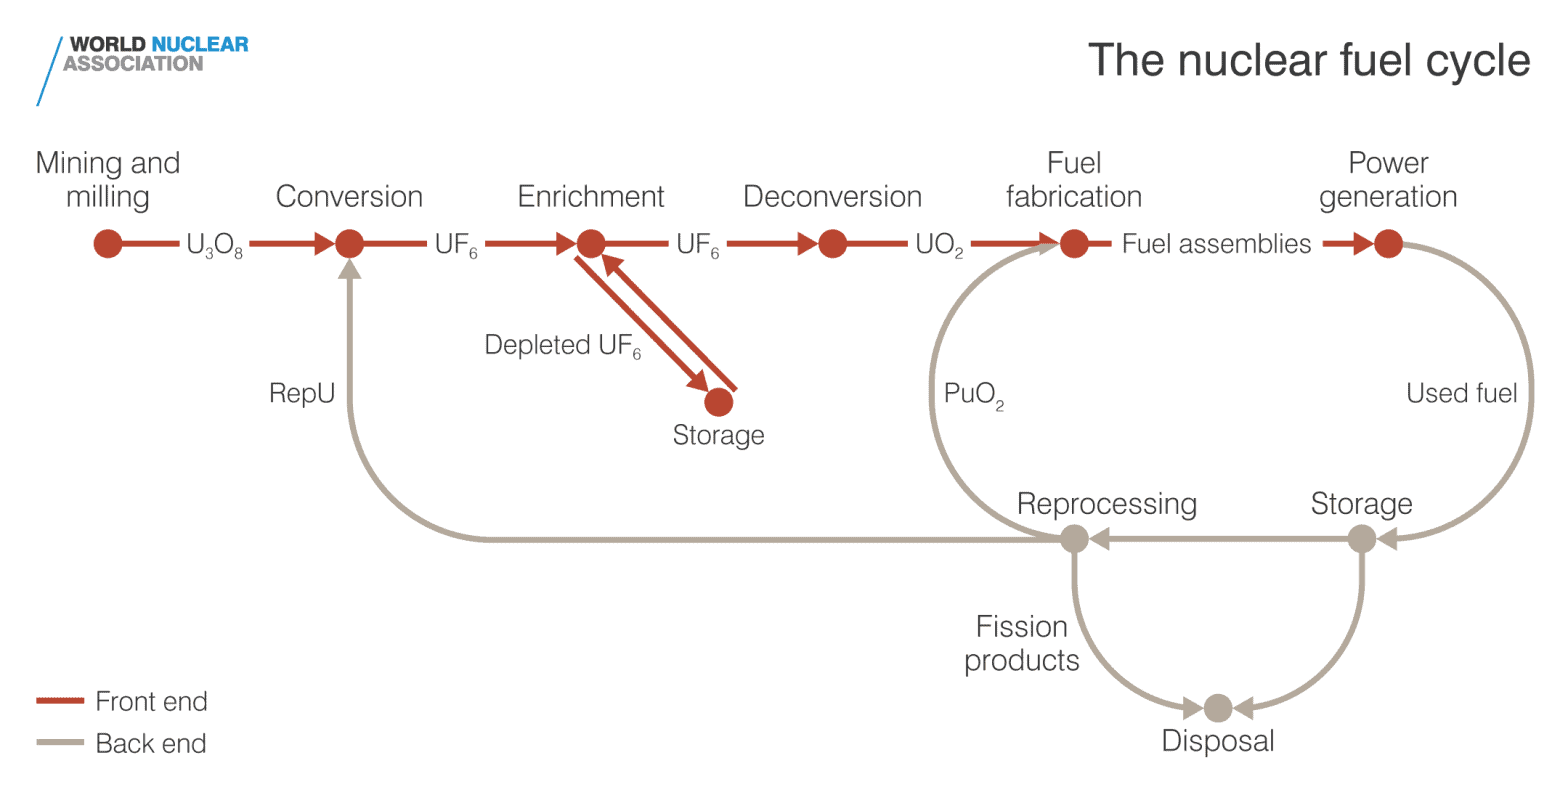
Its clients are nuclear utilities in 15 countries. Cameco represents 16% of the world production of uranium (total sales commitments of over 205 million pounds of U3O8) and has 21% of the world primary conversion facilities (total sales commitments to supply over 75 million kilograms of UF6). Furthermore, in November 2023, it completed the acquisition of 49% of Westinghouse. Its 2023 turnover (revenues in Canadian terms) was CAN$ 2.588 million (approx. US$ 1.887 million ; € 1.770 million), the produce of mining and milling representing 84,5% of their expected revenue for 2024 (Cameco 2023 Annual Report).
Orano (France)
Orano is a French state-owned company, created in 2017 out of the restructuration of defunct Areva, the latter resulting from the 2001 merger of Framatome, Cogema and Technicatome, all in turn stemming from French choices in terms of nuclear energy after World War II. Orano is active at all stages of the nuclear fuel cycle – front end, including enrichment, and back-end operations such as reprocessing and recycling as well as mines decommissioning – and in nuclear materials transport and logistics. The French state holds 90% of Orano, alongside Japan Nuclear Fuel Limited and and Mitsubishi Heavy Industries which holds 5% each (2023 Annual report, p.246).
Orano’s 2023 turnover (revenues) was EUR 4.775 million (USD 5.088 million). The mining sector represented 27,62% of the turnover (EUR 1.319 million; USD 1.405,55 million).
Navoi Mining and Metallurgical Company (Uzbekistan)
Navoi Mining and Metallurgical Company is the state company of Uzbekistan handling all mining and metallurgical matters. It focuses especially on gold but expressed a willingness to increasingly develop uranium mining (website).
It was incorporated as a joint stock venture in 2021, as part of an effort to reform the state enterprise.
For the year 2022, its revenue (all activities) were USD 5.095 million.
The Kombinats
Uranium One (Russia)
In 2007, Rosatom, the Russian State Atomic Energy Corporation, was reorganised as a state corporation (K. Szulecki, I. “Overland, I. “Russian nuclear energy diplomacy and its implications for energy security in the context of the war in Ukraine“, Nat Energy 8, 413–421; 2023; Nikita Minin, Tomáš Vlček, “Determinants and considerations of Rosatom’s external strategy“, Energy Strategy Reviews, Vol. 17, 2017, pp. 37-44). It not only provides for all stages of the nuclear fuel cycle, but also builds and exports nuclear reactors, while offering financing packages (Ibid.).
Rosatom revenues reached USD 27.300 million in 2023 (Tass).
Rosatom holds 100% of the voting shares of Joint-Stock Company Atomic Energy Power Corporation (JSC Atomenergoprom). JSC Atomenergoprom holds shares in 222 companies. It covers the whole cycle of nuclear production from mining up to electricity generation. According to its financial statements, in 2022, it ranked second in terms or uranium production with 14% of the market. In 2022, its total revenue reached RUB 1396,5 bn (“equivalent to” USD 19979,77 million at average exchange rate for 2022 1 USD = 69.8957 RUB), and the mining revenue, including but not limited to uranium, was RUB 24,7 bn (“equivalent to” USD 353,38 million at average exchange rate for 2022), out of which RUB 8,9 bn (“equivalent to” USD 127,33 million) were sold to “external customers (p. 59 and 17).
Its main mining companies are JSC AtomRedMetZoloto (ARMZ), directly held at 84,52%(the remaining shares belonging to Rosatom and TVEL JSC) and Uranium One Group. ARMZ represents mainly the domestic mining “division” and all Russian uranium producers are part of ARMZ (Interfax, “Rosatom plans to start commercial mining of uranium in Tanzania in several years“, 22 Nov 2022). In 2022, the revenues of ARMZ labelled as “the mining division of Rosatom” reached RUB 24,7 bn (“equivalent to” USD 353,38 million at average exchange rate for 2022 1 USD = 69.8957 RUB). Uranium One Group is “responsible for … uranium production outside the Russian Federation and is the world’s fourth-largest uranium producer” (Website). Uranium One Inc, originally Canadian, is an indirect subsidiary through Uranium One Group. In 2019 (latest financial statements available), Uranium One Inc. revenues were USD 394 million. So far, it operates mainly in Kazakhstan.
ARMZ has also handled overseas mining. In 2011, in Tanzania, ARMZ Uranium Holding Co acquired the Mkuju River deposit through the take over of Mantra Resources. The asset was then transferred to Uranium One Inc (Interfax, “Rosatom plans to start commercial mining of uranium in Tanzania in several years“, 22 Nov 2022).
CNNC, CGN and their satellites (China)
Two major companies operate for China and are both state-owned.
China National Nuclear Corporation (CNNC) oversees all Chinese civilian and military nuclear programs. CNNC is a participant in the Belt and Road Initiative and develops cooperation in this framework (CNNC, “CNNC contributes to the Belt and Road Initiative“).
It is the only company supplying domestic uranium (WNA, “China’s Nuclear Fuel Cycle“, 25 April 2024). It operates the mines in China through its subsidiary China Uranium Corporation Limited (CUC or CNUC, also Sino-U), which is also responsible to develop projects overseas (Ibid., CNNC Int Ltd “Corporate Information“).
CUC notably holds as wholly-owned subsidiary CNNC Overseas Uranium Holding Limited (“CNNC Overseas”), which in turn holds 66,72% of CNNC Int Ltd (Ibid.). The latter owns as an indirect wholly-owned subsidiary formerly Canadian Western Prospector Group Ltd. Western Prospector’s projects (uranium and coal) are located in Mongolia (Ibid.). CNNC Overseas transferred to CNNC Ltd notably the mines of Somina (Azelik Mines) in Niger. CNNC LtD is exchanged on the Hong Kong Stock exchange (Ibid). CNNC Int Ltd also acts as a trader in Uranium including for CNUC.(2) In 2022 CNNC Int Ltd revenues reached HK$ 567, 9 million (USD 72,61 million)
CUC/CNUC holds various mines and has different projects overseas through joint ventures or directly, notably Rössing in Namibia (Rossing Uranium CNUC Hand-over information 25 July 2019).
China General Nuclear Power Corporation (CGN) under the direction of State-Owned Assets Supervision and Administration Commission (SASAC) of the State Council of China owns China General Nuclear Power Co (CGNP). The latter is the Chinese platform for nuclear power generation. It owns CGN Mining Co Ltd (CGNM), which acquired CGN Global Uranium Ltd (CGNGU) in 2019 and also holds 100 % of CGNM UK Ltd. CGNGU trades CGN’s uranium resources on the international market. CGNM UK Ltd through a joint venture with Kazatomprom set the Mining Company Ortalyk LLP, founded in 2011, which holds the permits and exploits mines at the Central Mynkuduk and Zhalpak fields in Kazakhstan.
For 2022, the Group China General Nuclear Power Co recorded revenue of approximately RMB 82.822 million (USD 11.431 million). In December 2023, CGN Mining Co Ltd revenue was HKD 2.210 million (USD 282 million, Euro 263 million).
Besides holding and exploiting mines, China also complements its supply through purchases of uranium. For example, “in May 2014 China’s CGN agreed to buy $800 million of uranium through to 2021” to Uzbekistan (WNA, “Uranium in Uzbekistan,” 2 April 2024). Reportedly according to Chinese customs, Uzbekistan was “second only to Kazakhstan as a uranium supplier to the country” (Ibid.). In 2018, Orano was also an important supplier of natural uranium for the CGNP (Orano China website).
We should also mention a company such as Beijing Zhongxing Joy Investment Co., Ltd (ZXXJOY invest), located in Beijing, which is specialised on international mining projects including uranium mining but not solely focused on that mineral. ZXJOY invest is linked to ZTE, a partially state-owned telecommunication company (Management of ZXJOY invest; Raphaël Rossignol, “Uranium Nigerien, Le Coup De Maître De La Russie“, Forbes, March 2024). It notably participates in uranium mining projects in Niger (mine of Arlit – see below, third part) and Zimbabwe.
A new Klondike rush? Other uranium companies and projects and Junior companies
The U.S. does not have any major mining uranium company and appears to be, so far, little involved with operating mines abroad (EIA, Uranium Marketing Annual Report, 2023; WNA, “US Uranium Mining and Exploration“, Nov 2021; Nuclear Energy Agency (NEA)/International Atomic Energy Agency (IAEA), Uranium 2022: Resources, Production and Demand (Red Book), OECD Publishing, Paris, 2023). By 2023, the major exception is private company Quasar Resources (Australia – Four Mile Uranium Mine) belonging to Heathgate Resources Pty Ltd, a uranium mining Australian company (Beverley Mine), which is actually held by General Atomics, a privately-held very large American energy and defense corporation. In 2023, GA ranked 197 in Forbes’America’s Largest Private Companies (2023) with a revenue of USD 3.1 bn.
Australian companies are smaller and operate mainly in Australia or in Namibia. We have notably BHP Group Limited, a multinational mining and metals company exploiting, among other, uranium as a by-product of copper in Australia.
Paladin Energy is an Australian company in the process of restarting the Langer Heinrich mine in Namibia. The latter should start production during the first quarter 2024. Paladin Energy had no revenue in 2022 and 2023 (see 2023 financial statements p.71). Australian Bannerman Energy develops the Etango Project in Namibia, and, as a result, does not earn any significant revenue besides interests (2023 financial statements).
We also find two smaller Canadian companies, Global Atomic Corporation – Canada (GAC) and GoviEx, active in Niger. In 2023, GAC had a revenue of CAN $ 0,689 million (USD 0,5 million) and GoviEx had not yet engaged in commercial production, being still focused on exploration and projects’ developments (financial statements for 2022, p.13 ).
Many more companies will most probably emerge with time and discoveries. For example, on 9 November 2023, Canadian company NexGen Energy Ltd received ministerial approval under the Environmental Assessment Act of Saskatchewan for the Rook I Project. According to the company, the mine could “represent over 23 per cent of the world’s uranium production in the first few years of production” (Pratyush Dayal, “Sask. government approval brings new biggest uranium project in Canada closer to reality,” CBC News, 28 Nov 2023).
Companies seem to be perceived as junior when they are at the stage of uranium exploration and are smaller.
A new outlook for uranium potential supply
As a result, if we want to assess the supply situation for a country, we need not only to look at countries but also at national and foreign companies that hold reserves and resources, according to their joint ventures and mining permits, on a territory.
If we consider uranium resources according to reserves’ and resources’ holders, national or foreign, we obtain a vision of uranium resources per country, as shown in the charts below, which is different compared with the classical outlook we saw previously.
Methodology, sources and discrepancies
The overall uranium reserves and resources for a country will be composed of:
- the reserves and resources on the country’s territory held
- either by the state or national companies,
- or by foreign companies. This share of reserves and resources actually cannot be used by the state except if contracts are terminated in one way or another.
- the reserves and resources held by national companies abroad. In that case, the status and links of the national company operating abroad to the state will strengthen the capacity of the state to use the reserves held abroad and thus the security of supply. However, this type of supply is obviously less secure as those held by a state on its own territory, because contracts can be broken, expropriation can take place, etc. Nonetheless, they are reserves and resources available for supply.
For Kazatomprom, Cameco and Orano, as well as for corresponding countries where they operate, we used proven and probable reserves and measured and indicated resources (see glossary), then inferred resources as given in their respective 2023 annual reports.
However, we should note that the treatment of ore reserves and resources vary according to auditing companies. For example, when CRIRSCO (see Glossary) specifies that ore reserves should not be included in resources, a company such as SRK consulting, auditing mines for Kazatomprom, on the contrary highlights that “SRK’s audited Mineral Resource statements are reported inclusive of those Mineral Resources converted to Ore Reserves. The audited Ore Reserve is therefore a subset of the Mineral Resource and should not therefore be considered as additional to this” (SRK Consulting (UK) Limited, 2020 auditing report, p.23). On the contrary, Cameco follows CRIRSCO guidelines and reserves are reported besides resources (2023 Annual report, p. 104). Orano, for its part, only mentions its follows CRIRSCO in terms of reporting, thus logically excluding reserves from resources (2023 Annual report, p.34).
Furthermore the way future uranium prices are assessed strongly influences reserves and resources estimates, to say nothing of anticipating future exchange rates. For example, SRK Consulting for Kazatomprom estimates future yearly prices with precision for its assessment of reserves and resources. For its part, the NEA/IAEA presents resources according to price range.
Hence we have discrepancies stemming from multiple factors when seeking to assess the future of supply per country.
We exemplify this difference in the chart below comparing data provided by Kazatomprom and SRK Consulting (UK) Limited, for reserves and resources at the end of 2020 (pp. 23, 24, 29), and data from the NEA/IAEA 2022 Red Book, which correspond to the same period.
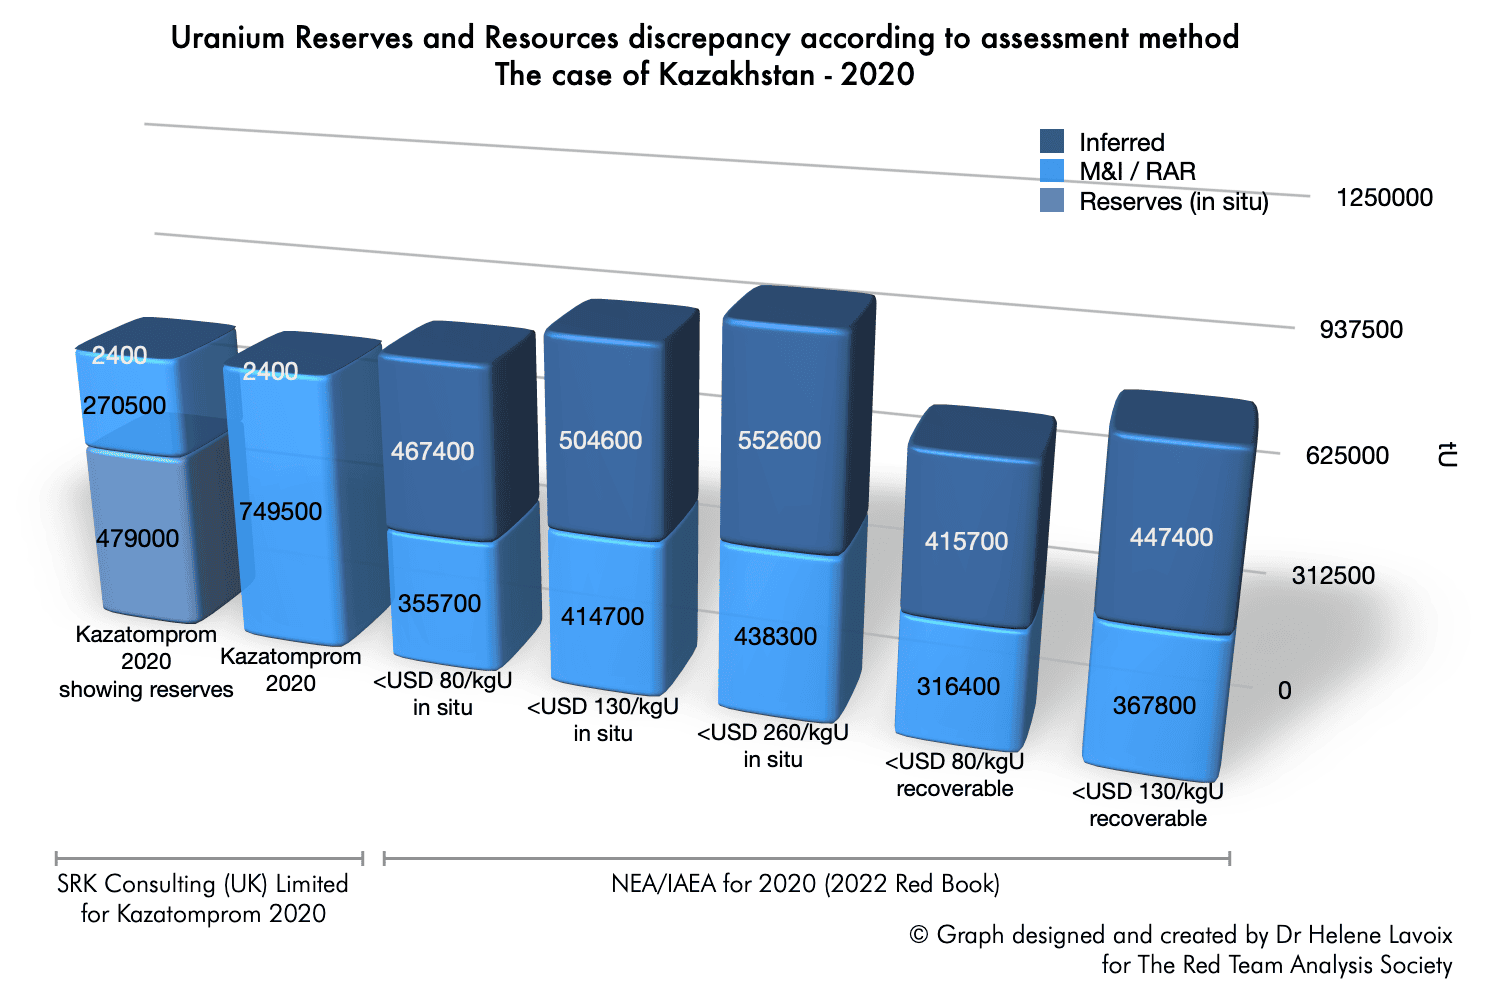
Uranium Reserves and Resources discrepancy according to assessment method
The case of Kazakhstan – 2020
The differences between the Kazakh estimates and the international agencies’ assessment are wide and vary from minus 19.800 tU when comparing Kazatomprom 2020 to NEA/IAEA Recoverable resources <USD 80/kgU (less Uranium for the NEA/IAEA), to 239.000 tU, when comparing Kazatomprom 2020 to NEA/IAEA in situ(3) resources <USD 260/kgU (less uranium for Kazatomprom).
In the worst case, the difference corresponds approximately to 13 years of 2024 estimated uranium requirements for the U.S., 18 years for China, and 29 years for France (see, for the yearly estimates, Helene Lavoix, “The Future of Uranium Demand – China’s Surge“, The Red Team Analysis Society, 22 April 2024).
Considering the complexity of the methodologies at work to estimate each type of reserves and resources, and differing types of reporting, it is impossible to reconcile easily et perfectly all statistics.(4)
Glossary
The classification of uranium resources varies according to actors.
For the NEA/IAEA:
“Conventional resources, as well as unconventional resources when sufficient data are available, are further divided according to different confidence levels of occurrence into four categories:
- Reasonably assured resources (RAR)
- Inferred resources (IR)
- Prognosticated resources (PR)
- Speculative resources (SR)”
The correspondance between systems varying according to countries is as follows, according to the NEA/IAEA, “Figure A3.1. Approximate correlation of terms used in major resources classification systems”, Uranium 2022: Resources, Production and Demand, OECD 2023.
NEA/IAEA, Uranium 2022: Resources, Production and Demand, OECD 2023, pp. 537-538
Identified resources Undiscovered resources NEA/IAEA Reasonably assured Inferred Prognosticated Speculative Australia Measured Indicated Inferred Undiscovered Canada (NRCan) Measured Indicated Inferred Prognosticated Speculative United States (DOE, USGS) Reasonably assured Inferred Undiscovered Russia, Kazakhstan, Ukraine, Uzbekistan A+B+C1 C2 C2+P1 P1 P2 / P3
For companies, such as Kazatomprom, Cameco and Orano, for example, the Committee for Mineral Reserves International Reporting Standards (CRIRSCO) establishes out of worldwide best practices and recommends the reporting international standard for estimates of mineral resources and calculations of mining reserves. Reserves and resources are explained in detail in the International Reporting Template (latest edition 2019):
CRIRSCO, International Reporting Template (latest edition 2019)
- Reserves: “A Mineral Reserve is the economically mineable part of a Measured and/or Indicated Mineral Resource…. Studies to Pre-Feasibility or Feasibility level, as appropriate, will have been carried out prior to determination of the Mineral Reserves.” (p. 25).
- Probable reserves: “A Probable Mineral Reserve is the economically mineable part of an Indicated, and in some circumstances, a Measured Mineral Resource. The confidence in the Modifying Factors applying to a Probable Mineral Reserve is lower than that applying to a Proved Mineral Reserve.” (p. 26).
- Proved reserves: “A Proved Mineral Reserve is the economically mineable part of a Measured Mineral Resource. A Proved Mineral Reserve implies a high degree of confidence in the Modifying Factors.” (p. 26).
- Resources (not aggregated with reserves): “A Mineral Resource is a concentration or occurrence of solid material of economic interest in or on the Earth’s crust in such form, grade or quality and quantity that there are reasonable prospects for eventual economic extraction.
The location, quantity, grade or quality, continuity and other geological characteristics of a Mineral Resource are known, estimated or interpreted from specific geological evidence and knowledge, including sampling.
Mineral Resources are subdivided, in order of increasing geological confidence into Inferred, Indicated and Measured categories.” (p. 19).
- Measured resources: “quantity, grade or quality, densities, shape, and physical characteristics are estimated with confidence sufficient to allow the application of Modifying Factors to support detailed mine planning and final evaluation of the economic viability of the deposit…” (p. 21).
- Indicated resources: “quantity, grade or quality, densities, shape and physical characteristics are estimated with sufficient confidence to allow the application of Modifying Factors in sufficient detail to support mine planning and evaluation of the economic viability of the deposit…” (p. 21).
- Inferred resources: “quantity and grade or quality are estimated on the basis of limited geological evidence and sampling…” (p. 20).
As a result, in the chart below, when available, we used corporate data as provided in the latest available comprehensive public report at the time of writing – most of the time yearly statements for 2023. When no other source was available, we used RAR, as given in the 2022 Red Book and by the WNA. We built the Reserves and Measured & Indicated Resources (R&R) per country from the bottom up, starting from mines and companies, as researched for our The World of Uranium: Mines, States, and Companies – Database and Interactive Graph.
A different outlook for uranium supply
In the chart below we look at reserves and resources according to their holders. The chart shows the reserves and measured and indicated resources (R&R) as they were before June and July developments in Niger (see Niger: a New Severe Threat for the Future of France’s Nuclear Energy?).

If we look at availability of supply through this prism, then the ranking changes for many countries, compared with the classical approach to reserves and resources.
Australia still comes first. The reserves and resources Australian companies hold abroad more than compensate for those foreigners hold on its territory. However, the very high level of Australian R&R should be considered with caution. Indeed, one single mine (the Olympic Dam mine), belonging to BHP group, holds 1.970.000 tU of R&R according to the company (uranium is produced as a byproduct of copper, the exact R&R are 1280600 in OC Sulphide and 689400 in UG Sulphide, BHP Group annual report 2023). This represents 86% of the known uranium R&R for geographical Australia. Furthermore at least one other large Australian deposit is currently unavailable (see forthcoming report). Hence the rich reserves and resources of Australian uranium could be partly a mirage.
Australia is followed by Canada with its active foreign operations, then by Kazakhstan, and its joint-ventures policy.
Canada, considering the extensive experience of Canadian mining companies on the one hand and of dealing with foreign companies mining in Canada could be in a far better position than Australia for the future. This may progressively change if Australia decided to change its nuclear policy, the debate on the matter being re-opened as elections loom (John Boyd, “Australia Debates Going Nuclear : A politician’s vow to build seven nuclear plants prompts fierce dispute“, 3 July 2024, IEEE Spectrum)
As a result, in geopolitical terms, uranium reserves and resources would be far less equally shared throughout the world than thought. For example, if the uranium-poor U.S. (see below) were thinking about relying on its close allies Australia and Canada for uranium supply, it could find that supply is far less readily available than hoped. It may take time to bring Australia resources to become exploitable. Meanwhile, Canadian influence in the world would also have the potential to be greatly enhanced, with consequences on Northern America.
Kazhakstan ranks third in terms of reserves and resources, while also being one of the main world producer. However, as Meirzhan Yusupov, Chairman of the Board at Kazatomprom, highlighted during an interview with the Financial Times (FT) the logistical problems stemming from the war in Ukraine and the closing of routes through Russia could favour Eastern markets (e.g. “Kazatomprom: Kazakhstan faces uranium supply constraints to West amid Ukrainian conflict“, 11/09/2024, Daryo). As a result, Kazhakstan’s position as a global supplier would be fragilised. Reciprocally, should transportation problems last, the supply of Western Uranium buyers could become complex. Similarly, those overseas reserves located East from Russia could become less readily available.
Without taking into account inferred resources, we then have Russia, with close to 40% of its reserves and resources coming from overseas mining. Unfortunately, the annual reports of the Russian mining divisions and holdings do not provide precise estimates for domestic reserves and resources. The resources used are those provided by international bodies. It seems, nonetheless, that Russia is well endowed with domestic uranium, which strengthens its security.
We may expect, considering the ever heightening international tension, as well as the May 2024 American sanctions banning imports of Russian uranium products, that Russia may increase its operations abroad, would it be only to deny or complicate uranium supply to the U.S. and its allies (“Congress Passes Legislation to Ban Imports of Russian Uranium“, Morgan Lewis, 13 May 2024). Russia could also seek to act on uranium long-term prices, making sure they are at a level that benefits Russia and its allies, while disrupting others’ strategies. The strong statements Russian and Chinese Presidents issued during the mid-May 2024 state visit of Russian President Putin in China, specifically mentioning energy cooperation, that “extends beyond hydrocarbons to encompass the peaceful use of nuclear energy” are another important signal enhancing the probability to see geopolitical tensions impacting and even shaping uranium mining (Website of the President of Russia, “Media statement following Russia-China talks“, 16 May 2024; Bernard Orr, Guy Faulconbridge and Andrew Osborn, “Putin and Xi pledge a new era and condemn the United States“, Reuters, 17 May 2024). Further research and analysis, as well as scenarios are more than warranted.
China then ranks 5, without inferred resources. Considering the planned development of its nuclear energy production over the next decades and the related considerable increase in its yearly uranium requirements, will these resources be enough in terms of supply (see The Future of Uranium Demand – China’s Surge)? China has been active in developing overseas mining as seen, and we can expect it will further strengthen these efforts. What will be the consequences globally? China also has a policy to purchase uranium through long term contracts. Thus, will these purchases, alongside development of overseas mining, be able to continue and increase without denying supplies to other countries? Here again, further research and keeping the issue closely under watch is warranted.
We then have Niger. Mines in Niger have been mainly developed by France, Canada, and China. As a further sign of the importance of strengthening uranium supply, on 13 May 2024, Niger’s government announced the decision to reopen the mine of Azelik held by the joint venture Somina, itself owned at 37.2% by CNUC (China) and at 24.8% by ZXJOY invest (China) and closed since 2014 (e.g. Le Monde, “Au Niger, une entreprise chinoise va reprendre l’extraction d’uranium après dix ans d’interruption“, 14 May 2024). Beforehand, on 10 May 2024, ZXJOY invest had met with Niger Ambassador highlighting “future opportunities for investors between China and Niger” (ZXJOY CEO Met with Niger Ambassador, website). That decision had been prepared in June 2023 through an agreement between CNUC and Niger’s government planning for the reopening of the mine (Ibid.).
Furthermore, as events and developments in 2024 show, Niger is part of powerful political and geopolitical forces, which interact with the politics and geopolitics of uranium supply (see Niger: a New Severe Threat for the Future of France’s Nuclear Energy?). The coup in Niger has upset the previous state of play, as seen in the Nigerien decision to end military cooperation with the U.S. following American reaction to Nigerien desire to sell uranium to Iran (Le Monde, “Au Niger, la question de l’uranium à l’origine de la discorde avec les Etats-Unis, selon le premier ministre“, 14 May 2024). Thus, considering reserves and resources there will imperatively demand to count with those forces and act accordingly.
The EU then ranks seven, thanks to France and Orano’s mining expertise and portfolio overseas.
France, for its part ranks 8th and the EU without France 16th. France’s position, compared with the classical vision of reserves and resources is thus considerably changed, moving from an apparent absence in the world of suppliers to a rather strong place, even though overseas reserves and resources are less secure than those held on one’s territory, as the situation in Niger shows (Niger: a New Severe Threat…). This should lead to a foreign policy and strategy considering the necessity to both secure these key supplies and develop them.
Meanwhile, the untapped European resources should also be kept in mind. Europe should, in the light of the aim to triple nuclear energy production by 2050, starts developing its mines, all the more so considering the long timeline from exploration to production. In any case, ranking 7 worldwide for Europe further legitimates the March 2024 creation of the EU Nuclear Alliance (Declaration of the EU Nuclear Alliance, meeting of March 4th, 2024). Europe here could play a strong card in terms not only of energy security but also of international influence. Thanks to uranium, it could notably find back a leverage with the U.S., which could help the old continent win back its independence.
We then have Namibia with the policy to let foreigners develop Namibian mines. The mines in Namibia are operated mainly by China and Australian companies.
Also noteworthy, the U.S. only ranks 10. Not only its efforts to secure supply abroad are sparse, but part of its own uranium mines are operated by foreigners, mainly Canadian (note that Rosatom’s holdings of American mines were sold to Texas-based Uranium Energy Corp in Nov 2021, “UEC to buy Uranium One’s US uranium assets“, World Nuclear News, 9 Nov 2021).
Considering the U.S. current and future needs, we may wonder if the present apparent absence of interest and efforts overseas is strategically coherent. As highlighted above, hoping for Australian and Canadian supply may not be that secure. Furthermore, the cooperation between Russia and China in the peaceful use of nuclear energy, in the framework of China’s increasing needs in uranium, may strongly impact uranium availability.
To conclude, if we use the revisited perspective on uranium reserves and resources in the light of current uranium requirements and stakes regarding electricity production stemming from nuclear energy, we obtain the charts on the right hand side column below. For the sake of comparison we give the classical approach on the left hand side column.
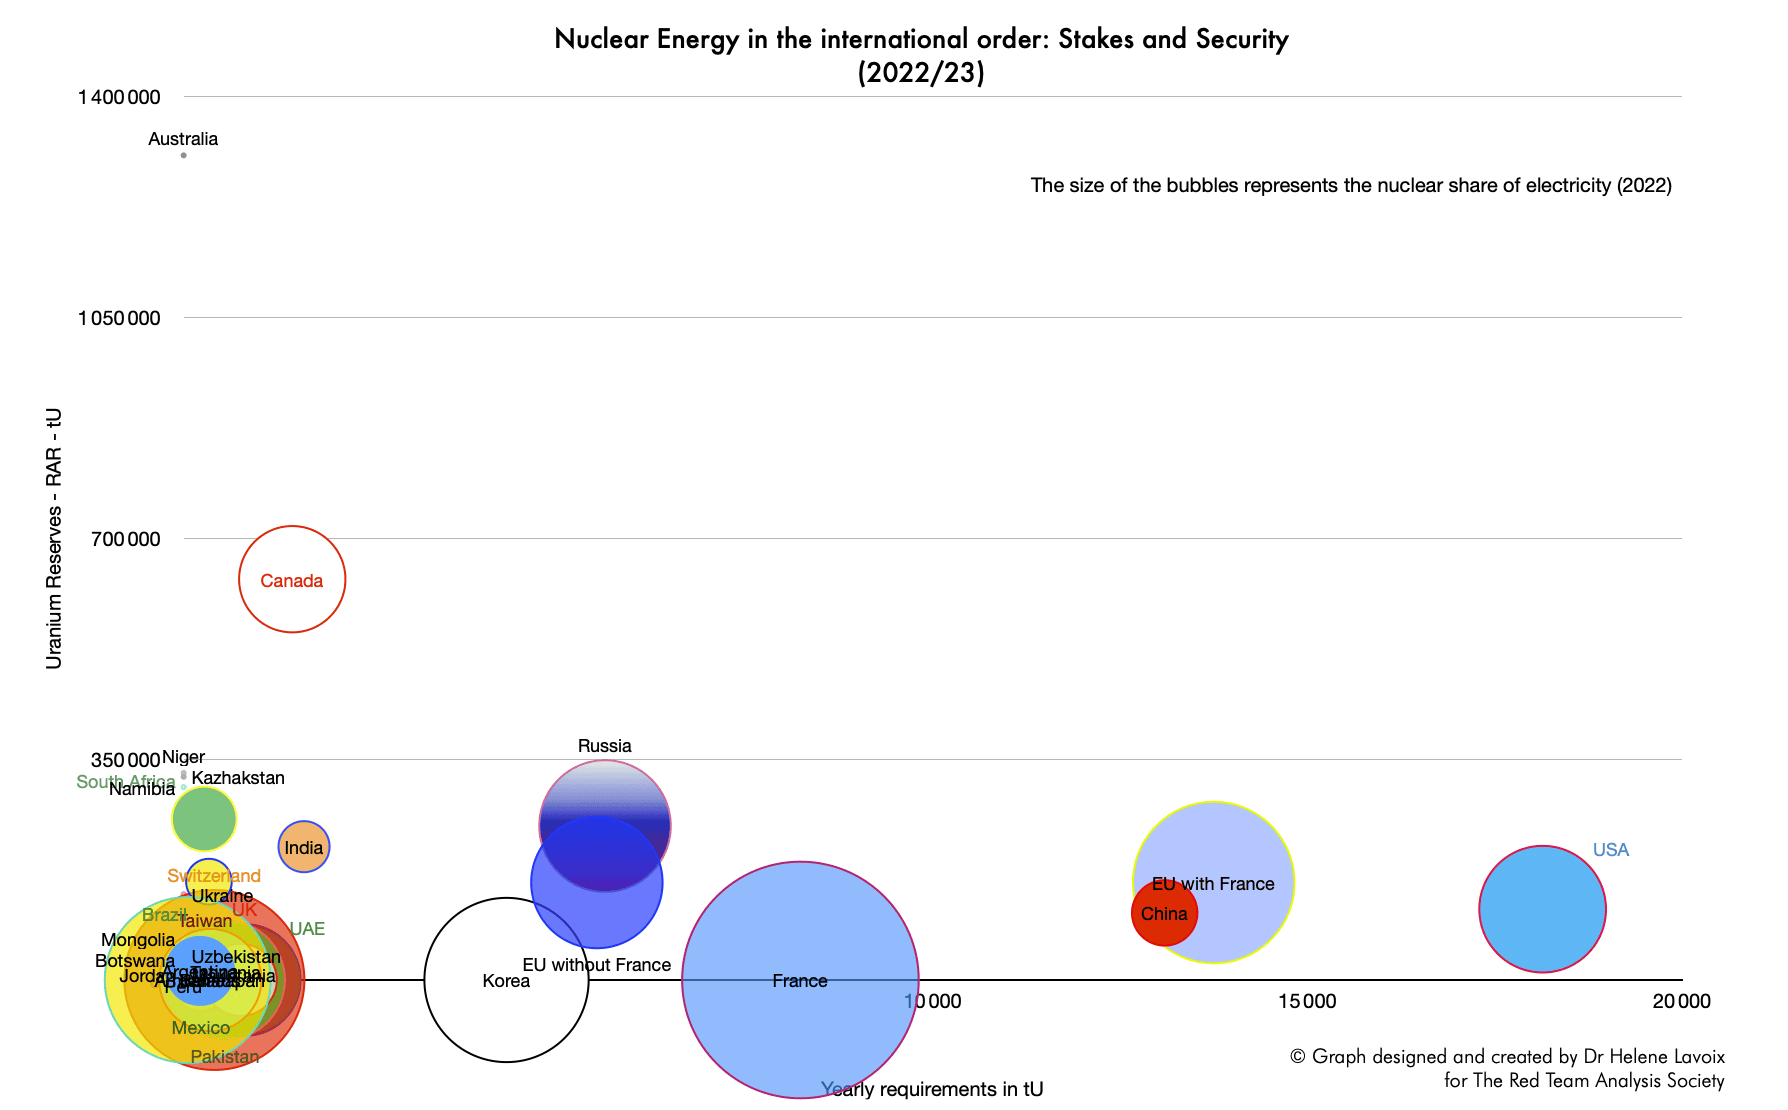
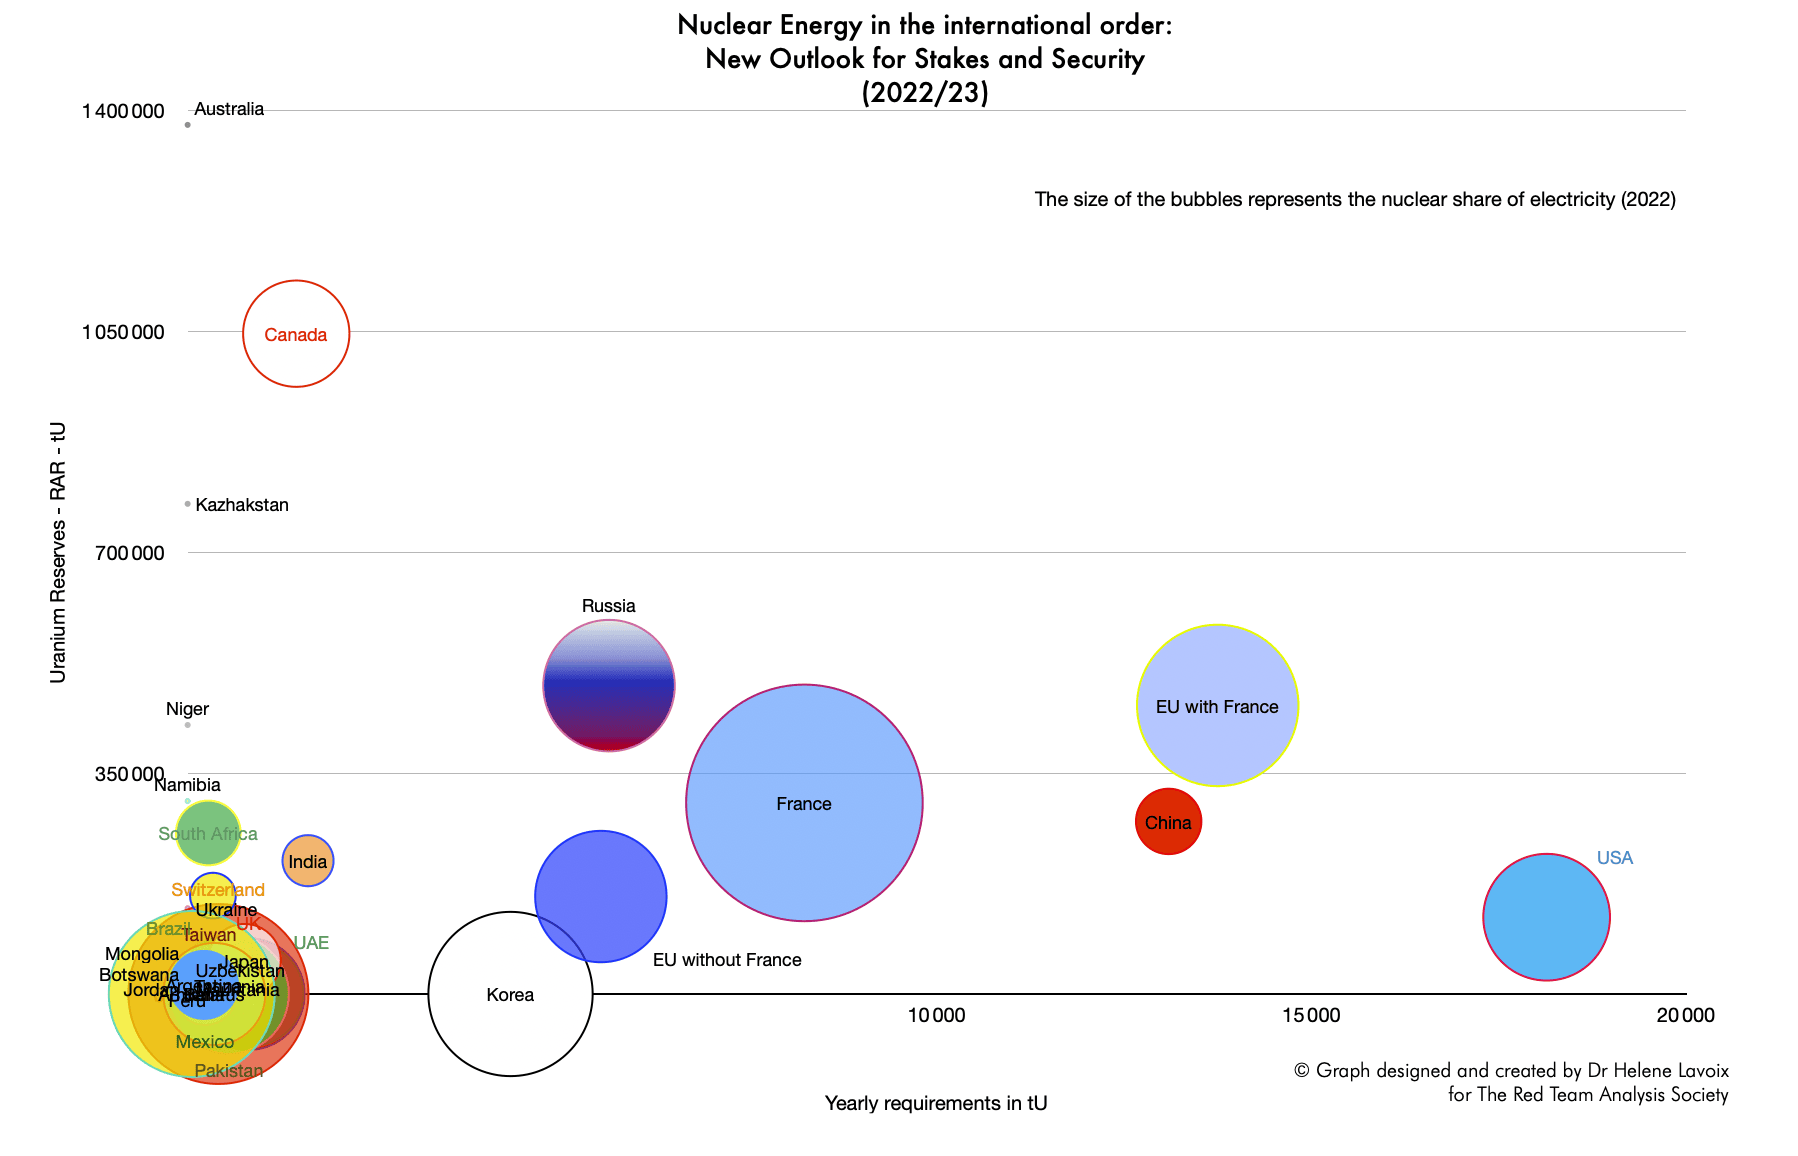
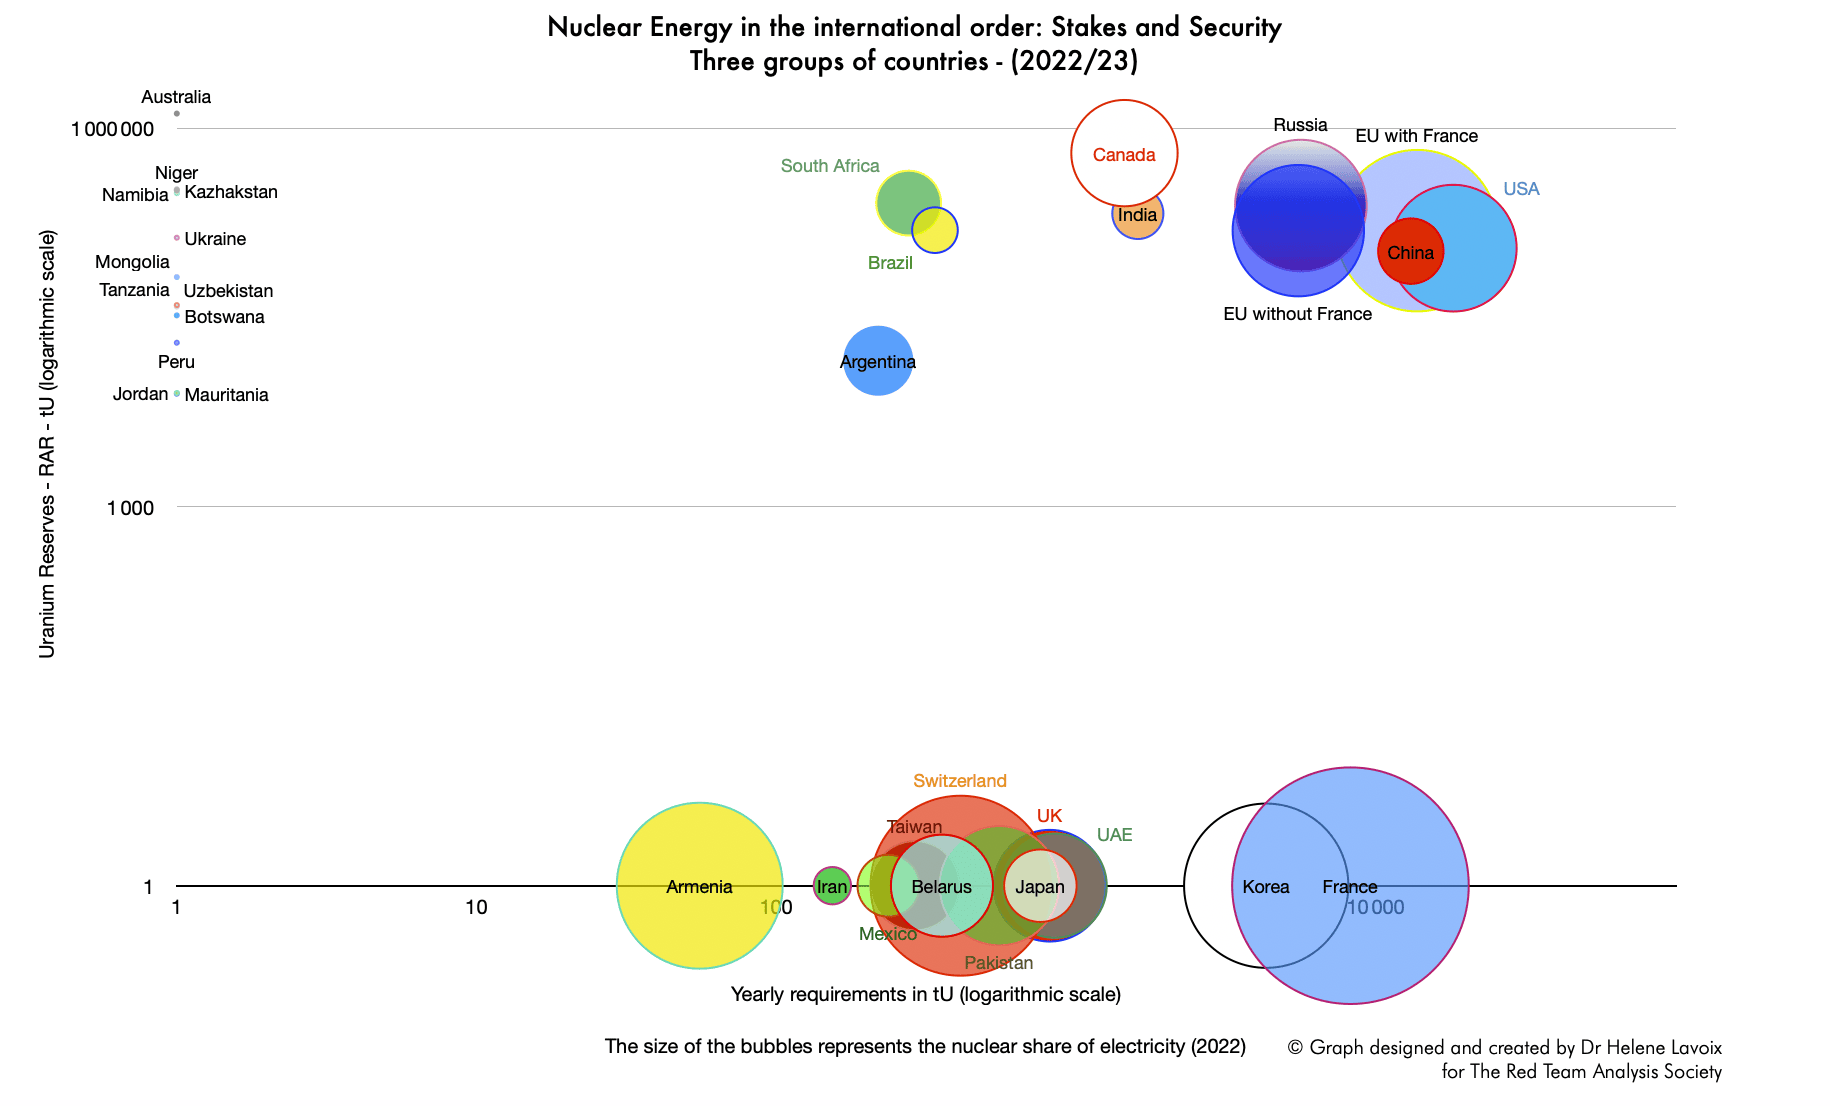
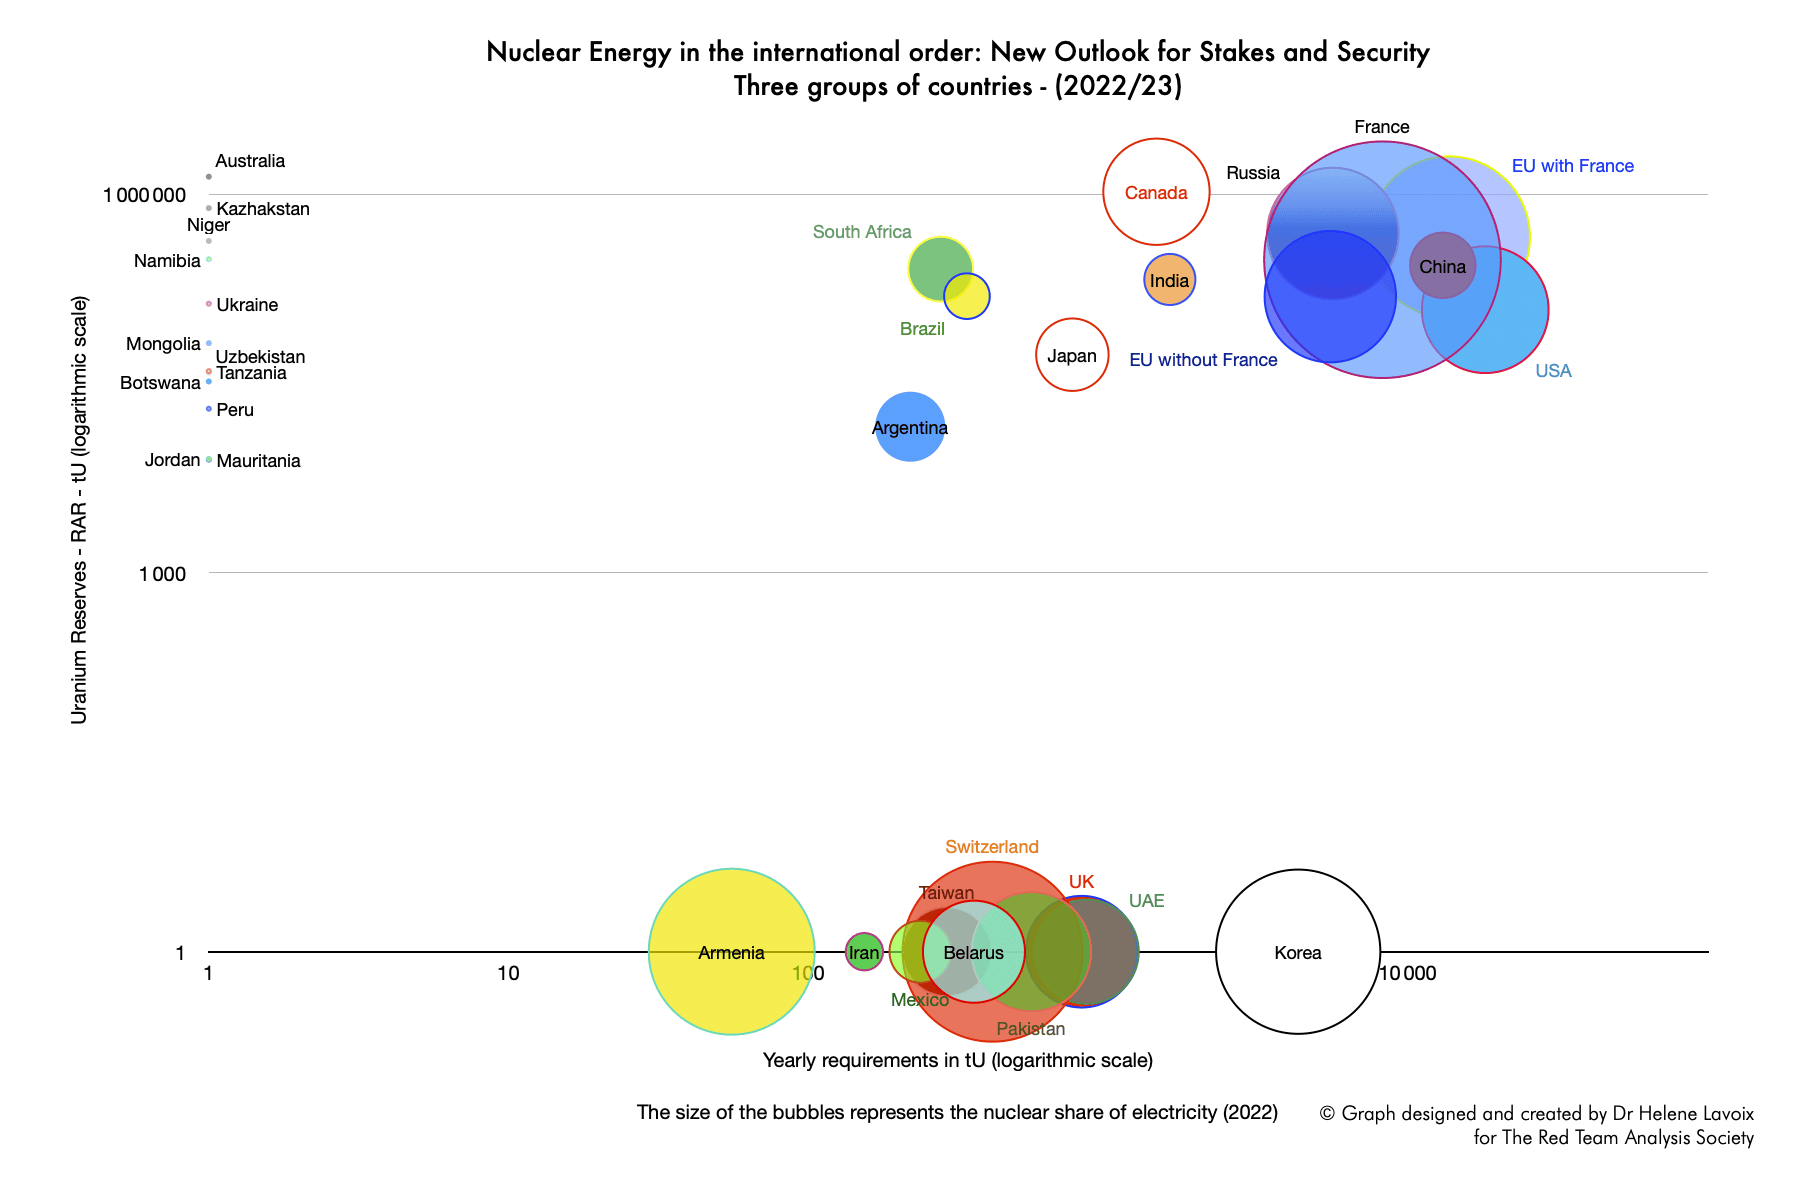
The most staggering changes concern France, and of course, consequently, the EU with France, as well as Japan, thanks to its joint-ventures in Kazakhstan and to Japanese companies share in French Orano. We can see that the security of uranium supply for these three state and quasi-state is much stronger than initially thought. All move into the group of state actors with both important stakes in nuclear energy and a relatively balanced security in terms of supply and requirements.
The revisited approach reveals an improved situation for Russia and Canada, which already benefited from a secure and balance outlook. China’s situation also appears as better than thought.
By contrast, relatively, the U.S, appears as lagging behind the others.
Now, in this article, we have only looked at reserves and resources. Moving from reserves to production should add another layer of complexity to the issue.
Notes
(1) Similar approaches should also be developed for each stage of the fuel cycle to have an exhaustive vision of the field and its security.
(2) Following various circulars and frameworks signed in 2022, the activities of CNNC Group Ltd are defined as follows:
“The Group agreed to
i) act as the prioritised supplier of CNUC Group for its short term demand for natural uranium products and the regional sole supplier of CNUC Group for its medium-to-long-term demand for natural uranium products; and
ii) act as the exclusive authorised distributor for the sale and distribution of uranium products produced by the Rössing uranium mine (being indirectly owned by CNUC as to approximately 68.62%), for on-sale to third party customers in all countries and regions around the world except the PRC.”
2023 Annual Report, p. 6
(3) According to the NEA/IAEA, “in situ resources are referring to the estimated amount of uranium in the ground” before considering way to recover resources (pp. 10, 17). The NEA/IAEA then applies recovery factor to get the recovered resources (Ibid.). Here, in the case of Kazakhstan, the factor applied is 88,38% and 88,18% to go from in situ resources to recoverable ones.
(4) The more recent German BGR Energiestudie 2023 (Feb 2024) does not either allow reconciling data easily if we take Kazakhstan as example.


Leave a comment