(Art direction and design: Jean-Dominique Lavoix-Carli)
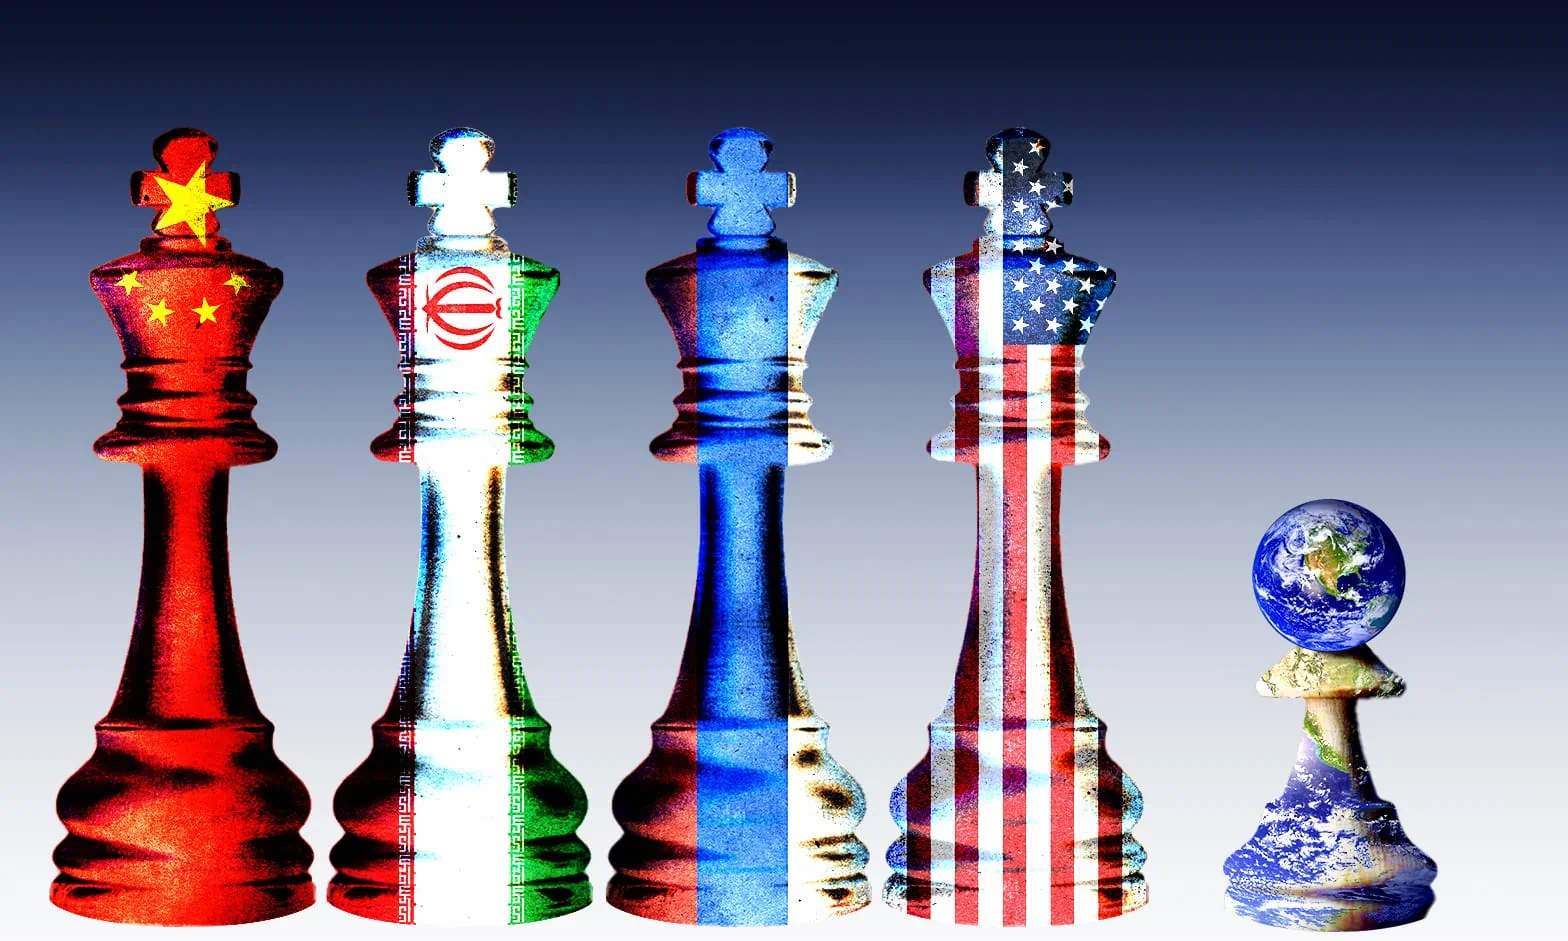
Given the escalating geopolitical tensions at the beginning of 2024, it is crucial to understand the evolution of the international influence of players on the world stage and its trends.
In this article, we offer a vision of this international influence and how it changed over time, since the end of World War II. We use participation in regional and multilateral fora displayed in a graph to gage this influence.


First, we present the results of this study through a series of images and through a video showing the dynamic evolution of the graph through time. We move then to tell the story of the evolution of international influence as depicted by the graph visualisation and highlight main points. Finally we explain how we built the graph.
Visualising the evolution of multilateral international influence from 1945 to 2024
We considered the following fora, focusing mainly on general and security related organisations (by alphabetical order): Five Eyes (FVEY – an Anglosphere intelligence alliance), the ASEAN Regional Forum (ARF), the ASEAN, the African Union (AU), the Belt and Road Initiative (BRI – using notably research by the Green Finance & Development Center), the BRIC then BRICS then BRICS+, the Commonwealth of Independent States (CIS), the Collective Security Treaty Organization (CSTO), the European Union, the G7, the G20, NATO, the Organization of American States (OAS), the Quad, the Shanghai Cooperation Organisation (SCO), defunct Southeast Asia Treaty Organization (SEATO), United Nations Security Council Permanent Members, defunct Warsaw Pact. We further explain below how we built the graph and handled each organisation.
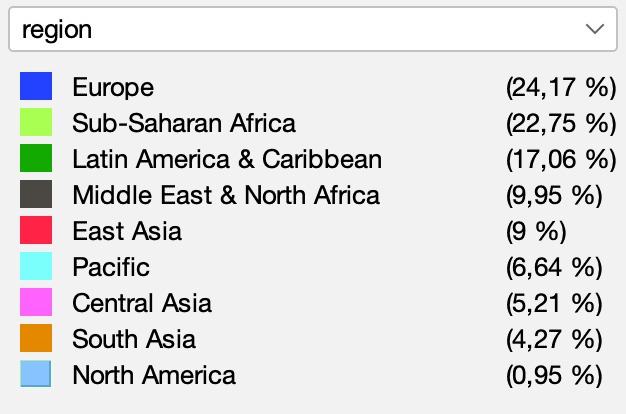
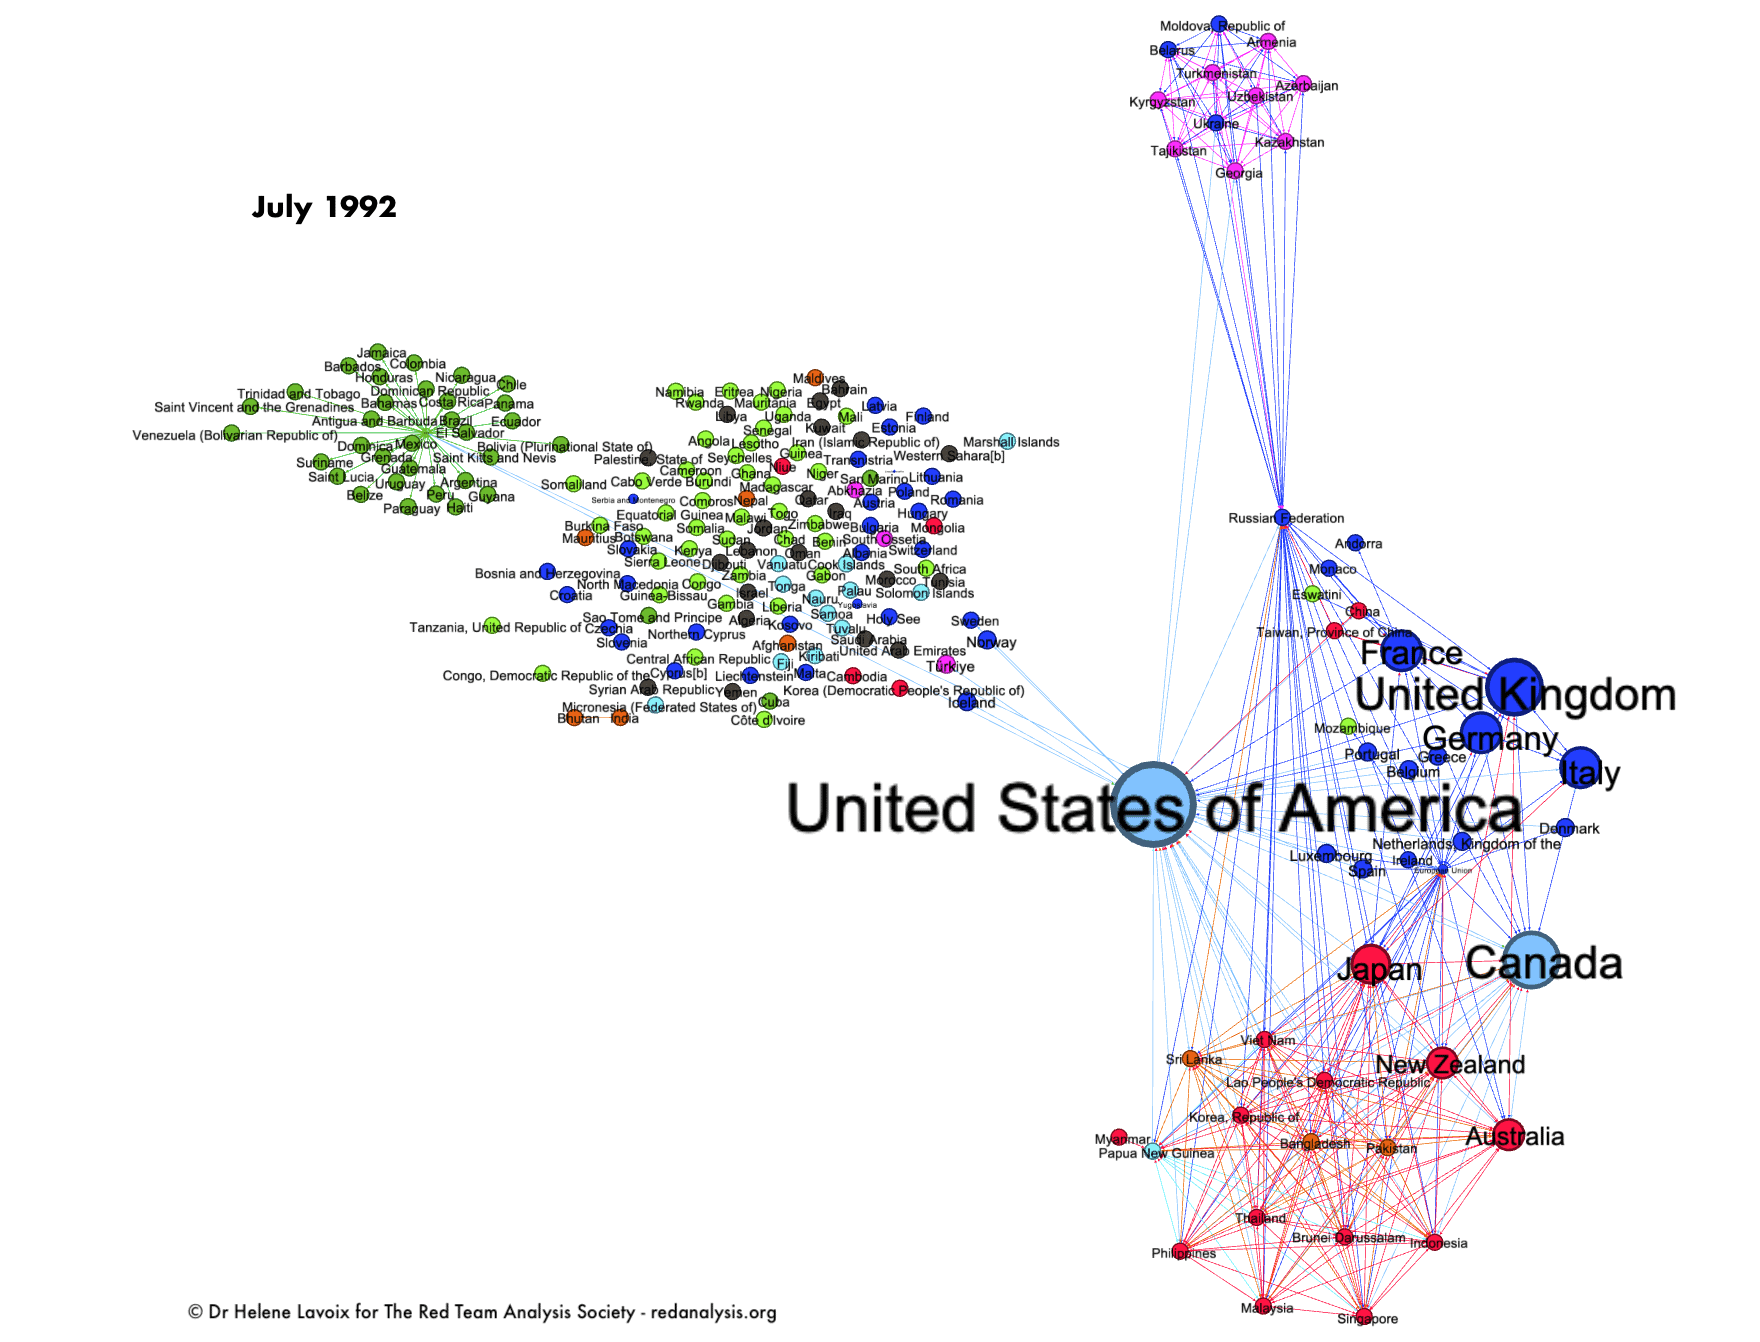
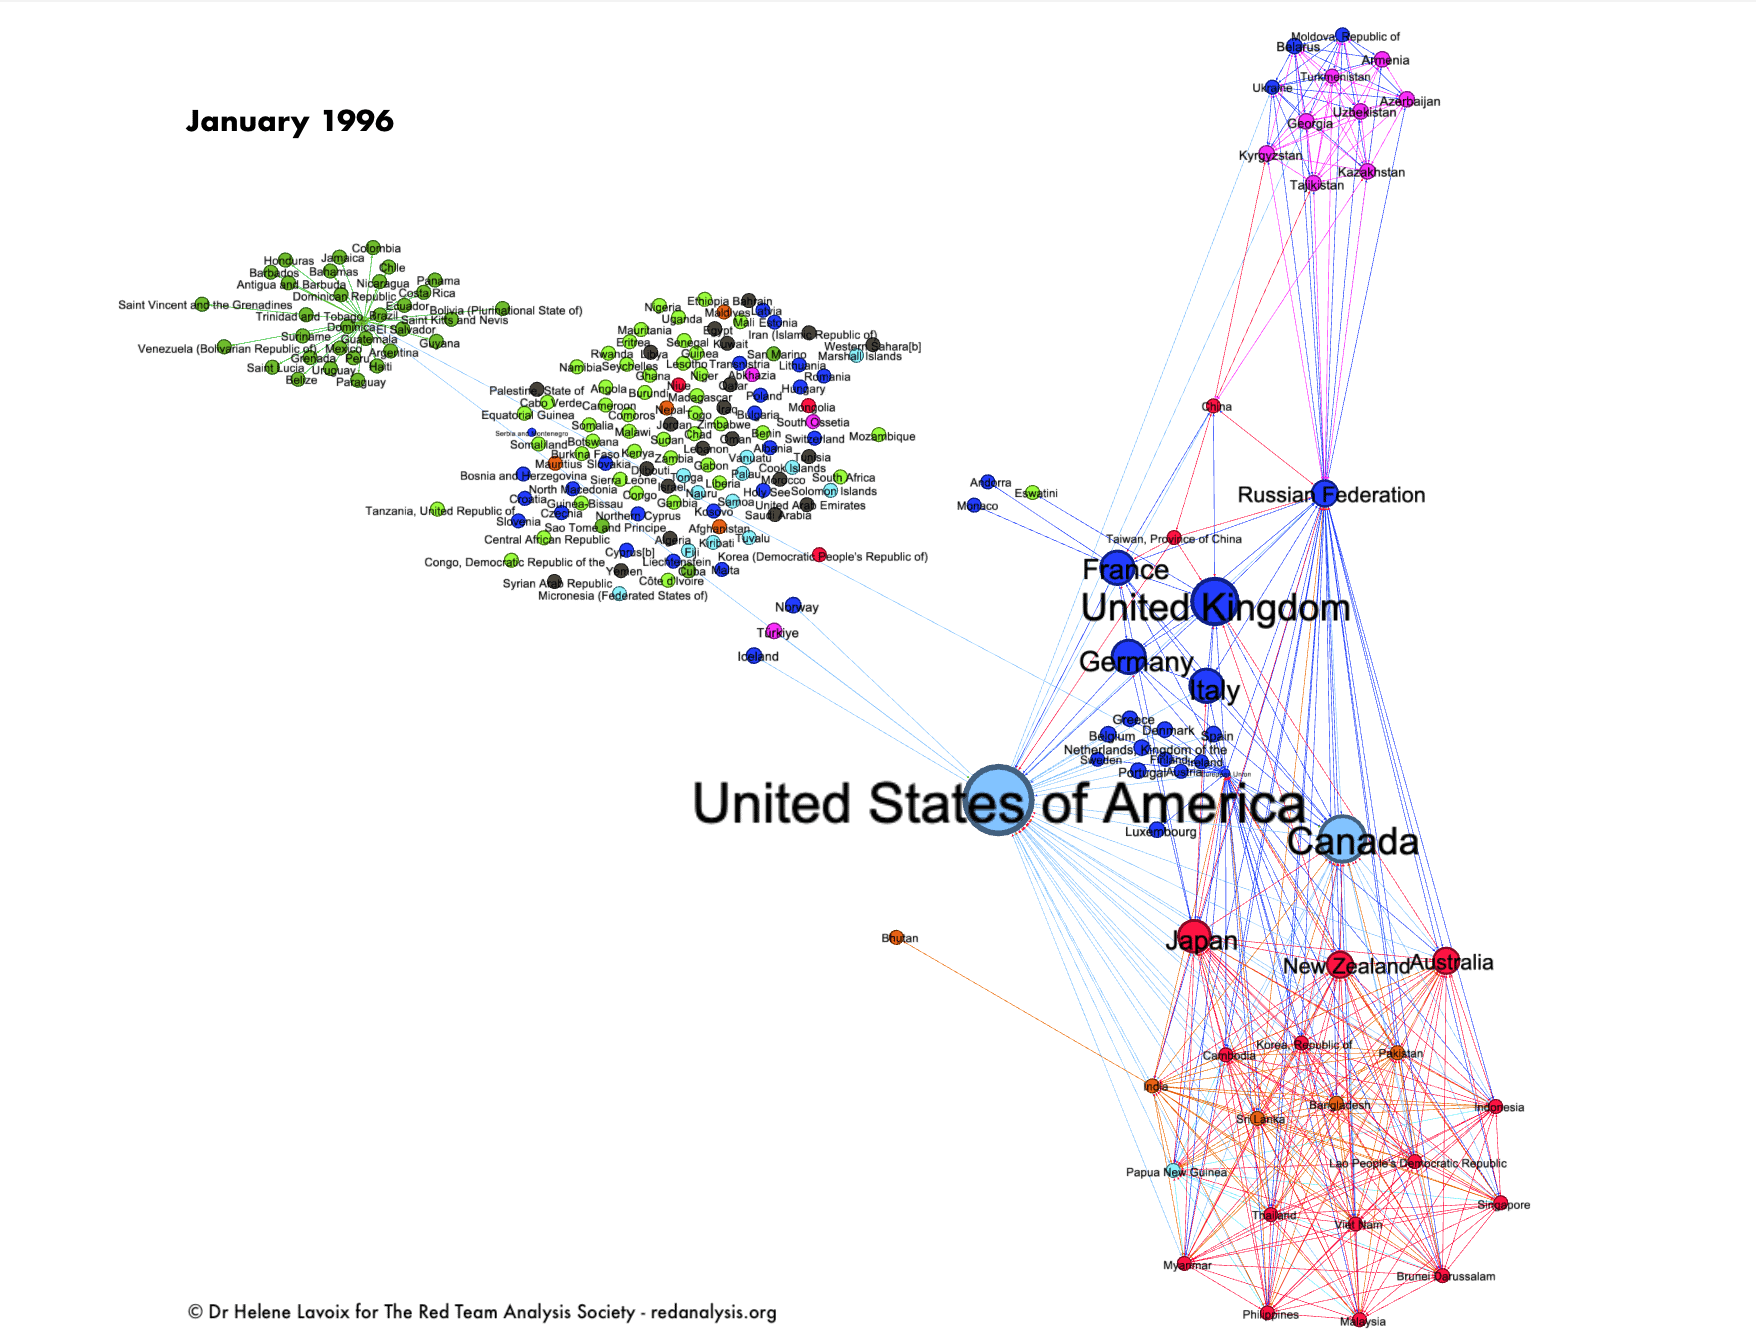
In the graphs below, each country is coloured according to its geographical region (the percentage represents the share of each region in number of countries compared with the total number of countries included for the entire period).
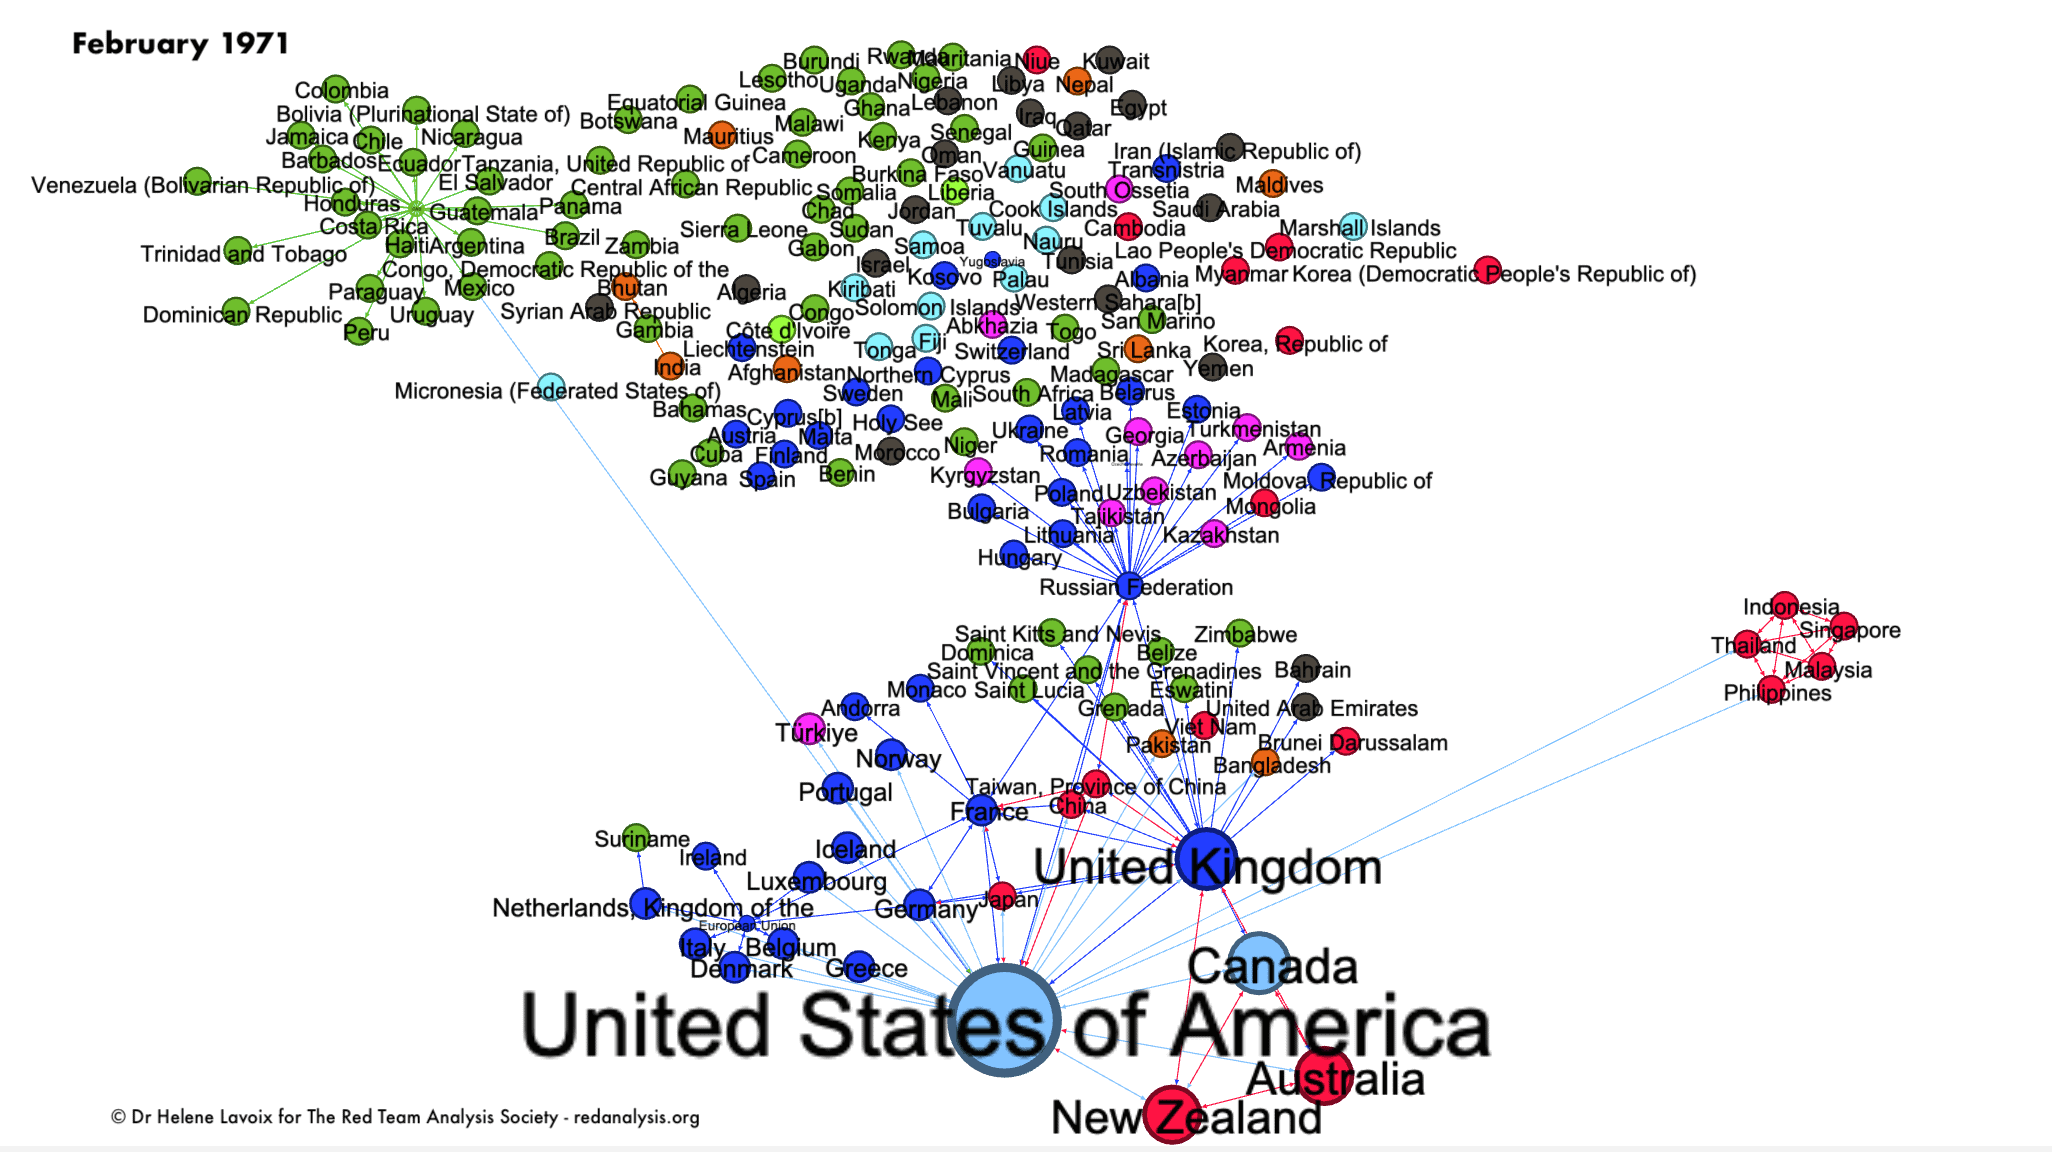
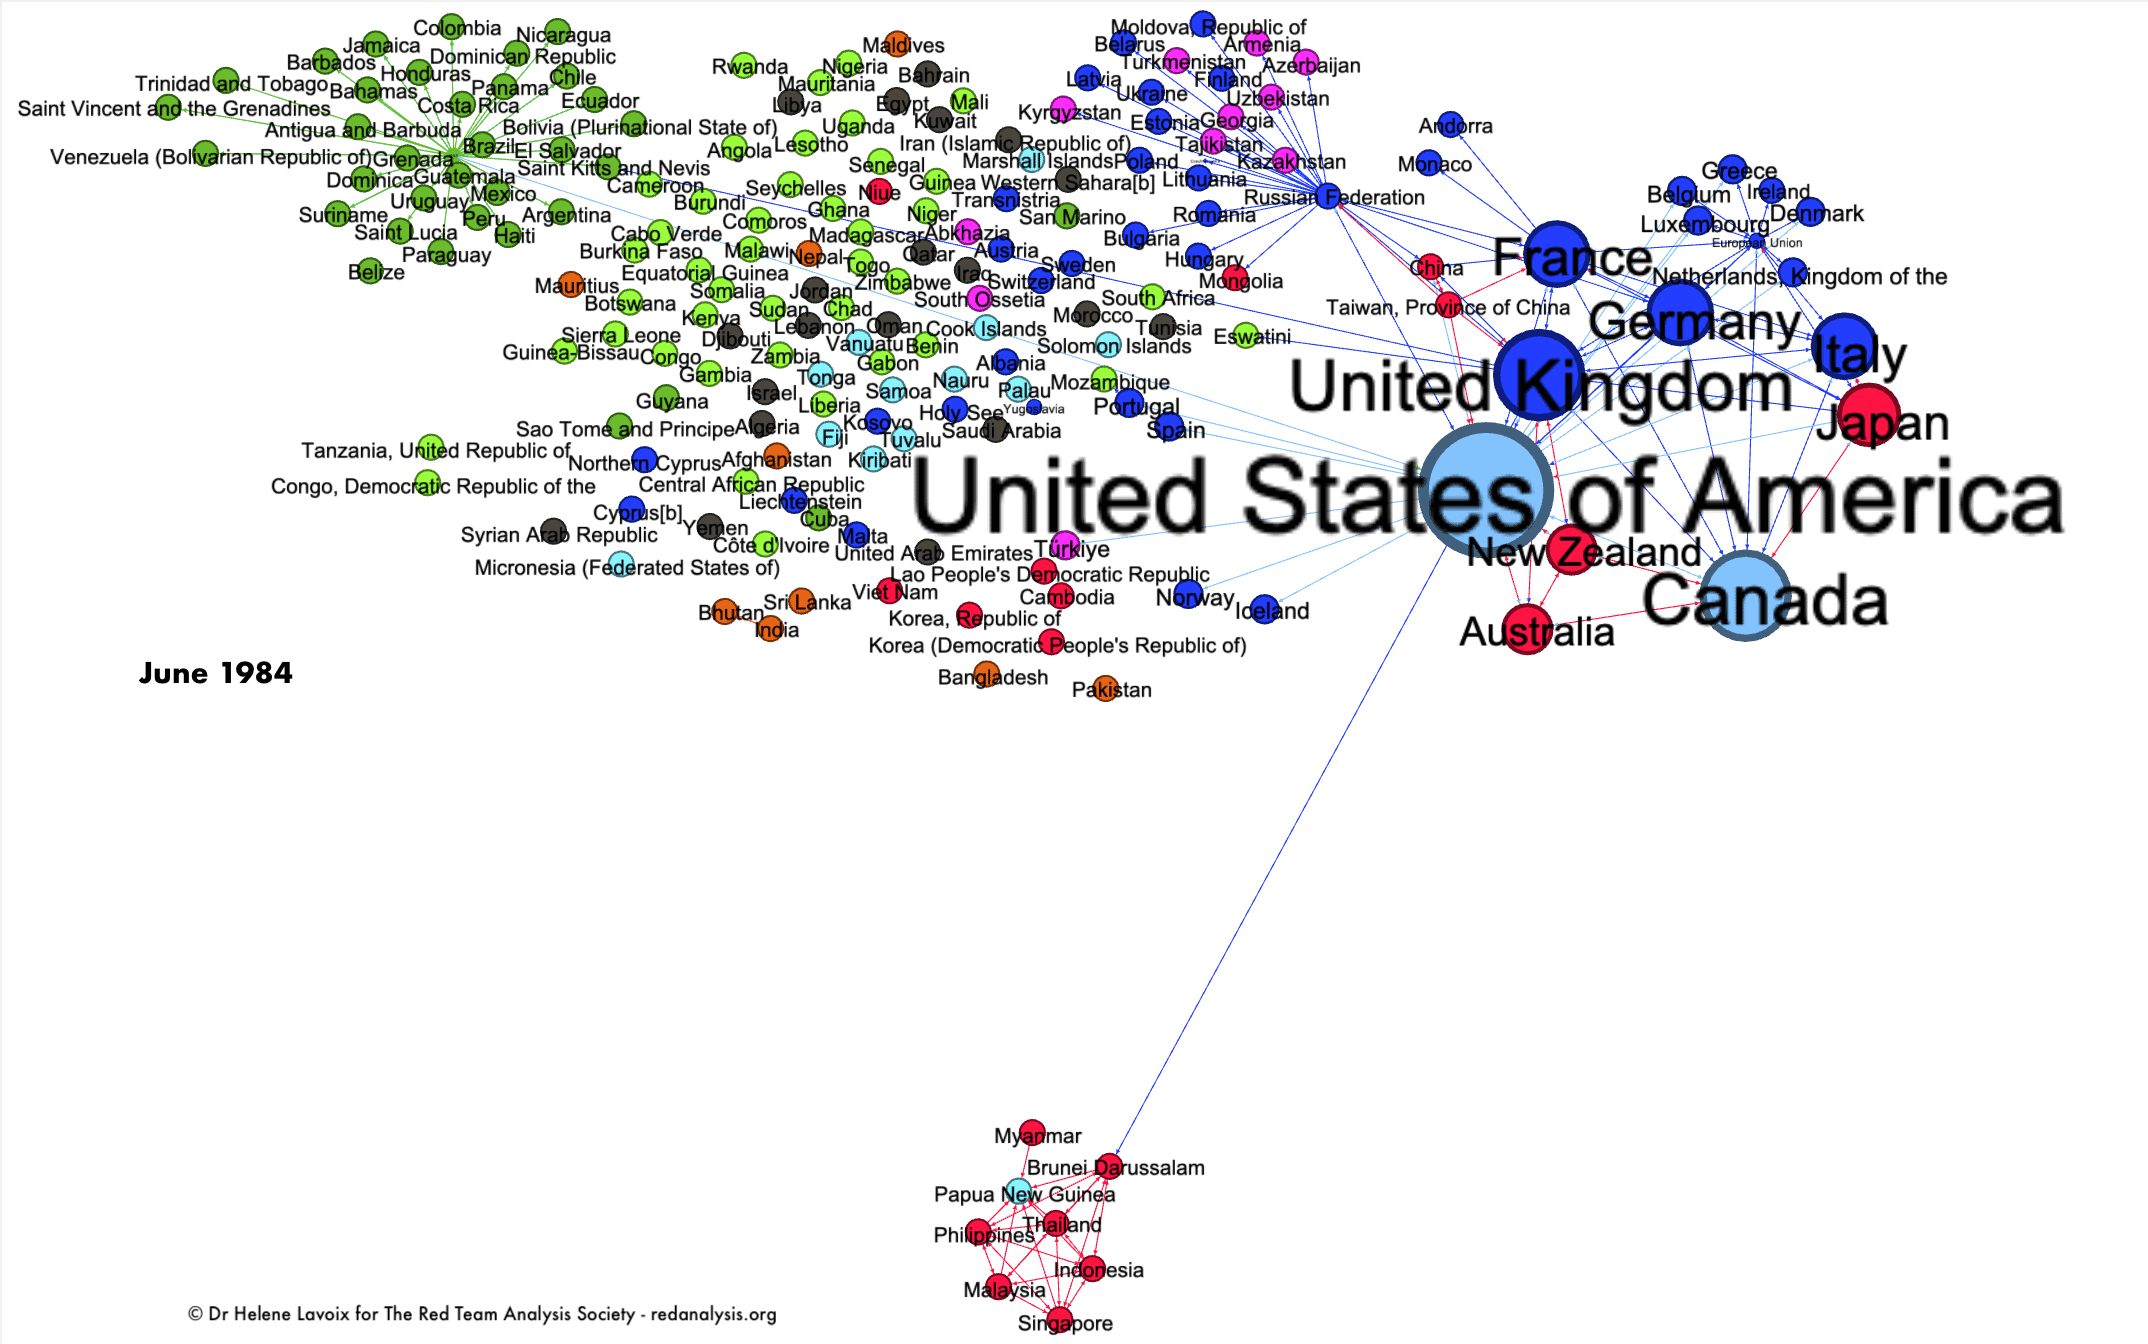
Here are the results depicted as a series of screenshots (click on each picture to see a larger one in a new window). The years were chosen because the graph showed an evolution of the system for that time period.


The evolution of international influence through regional and multilateral fora can also be visualised through a video:
Now we have a dynamic graph depicting the evolution of international influence resulting from multilateral and regional fora. What analysis can we make using this visualisation?
Rise and demise of the international influence of state actors from 1945 to 2024
We can see the U.S. dominating the international order from 1945 until approximately the end of the millenium.
During this period, the “grand moment” of the U.S.-led Western world plus Japan lasts from the end of the 1970s until the mid-1990s.
However, in 1992, we start seeing Russia rising. This turns upside down the perception according to which the collapse of the Soviet Union was a victory for the U.S. and its allies. Then, during the second half of the 1990s, if the U.S. and its close allies remain dominant, we nevertheless see the rise of China and the increasing influence of Russia. At the turn of the millenium, Russia has an influence which is almost on a par with the U.S.’s, followed by the UK, then Canada, then France and Germany, then Japan and Italy, then by China, Australia and New Zealand.
The following two decades sees the U.S. succeeding in remaining as influential as Russia. Yet, in the meantime, its main allies relatively lose influence, while China gains influence and is now more influential than the UK. Brazil and India also become more influential players on the world stage, on a par with Japan. This time also saw the emergence of Iran as an influential player, although in a slightly lesser way.
At the start of 2014, Russia is as influential as the U.S., while China has become more influential than all other players apart from Russia and the U.S.. This validates the U.S. strategy that one may see emerging around 2013 to try to stop Russia’s gain in influence. In 2016/2017, Russia saw indeed its international influence diminish, but the U.S. did not regain anything, and its influence decreased. The great winner was China, while India and in a lesser way Pakistan saw their influence increase. The U.S. allies all saw their relative influence diminish.
The early 2020s confirmed the rise of China, now with an international influence far above the influence of other players, including the U.S.. Meanwhile and very interestingly, Middle east and northern African countries moved away from the U.S. sphere of influence towards the “Russian group”, which is confirmed in 2023. We can also see then Ukraine drifting towards the US. and its allies. China, so much more influential than anyone now, seems to sit on top yet also in the middle of everyone, somehow enacting its name, the “Middle Kingdom” (Zhongguo 中國).
It would be particularly interesting to add other multinational fora, as well as other dimensions to see if other variables and elements change the story of international influence, and in which way.
Meanwhile, this graph of the evolution of international influence casts an interesting light on Russian Foreign Minister Lavrov’s analysis on the evolution of the international order. He sees it as a quasi-determined evolution towards a polycentric world grounded in regional and multilateral fora (see video Sergey Lavrov Interview with RIA Novosti and Rossiya 24 – English Subtitles by Michael Rossi – Dec 28 2023 – esp from 58:53 to 1:04:36).
Of course, as Russia – and China – abide by this worldview and thus have adopted the related strategy, they also carry out the actions necessary to see their strategy succeed. They are thus very active in strengthening and developing these multilateral and regional organisations. As a result, the graph here also measures their efforts.
Other actors, such as the U.S. or European member states and the EU could very well decide upon another type of strategy, emphasising very different ways and means. We could then develop a graph focused around this strategy. At the end we would have two visions of influence competing for power.
How we built the graph of international influence
The graph is dynamic, which means that it evolves across time. Overall it includes 211 actors (states and quasi-states) and 2256 links (directed edges or arrows), each representing influence of one actor over another.
We did not account for World War II.
The graph is done with the open source software Gephi.
Actors
Each actor is represented by a node (a circle on the graph). It is an independent, sovereign and territorial state or quasi-state.
Accounting for the dissolution of the Soviet Union
To obtain continuity in our graph, we kept the name Russia throughout time whatever the regime of the country. We proceeded similarly for each Soviet Republic. For example we used “Kazakhstan” for the current “Republic of Kazakhstan” and previously the “Kazakh Soviet Socialist Republic”.
Until 1991, we expressed the relationship with the Soviet Republics through a directed link from “Russia” to each Soviet Republic.
Accounting for decolonisation
For the sake of simplicity and to have a dynamic graph that is useful across time, we could not account for the variety and complexity of each situation. We tried however to be as logical and representative of reality as possible. When colonised countries were fully part of the colonising country, we used the date of independence as date of “birth” for the country (in graph language a new node is created). When colonised countries were under regimes of protectorate or had autonomy for a while, then we considered the country as existing prior to independence and added a directed edge from the colonising country to the autonomous country. For example, this is the way we portrayed the situation for the British Raj, even though it is far more complex.
Accounting for the People’s Republic of China (PRC), the Republic of China (ROC) and Taiwan
Our aim is to portray influences and tensions, not to make a political statement.
Taiwan currently “province of China” is considered as the ROC until 1971, holding the permanent seat for China at the UN Security Council. From 1971 onwards it is replaced by the PRC. We use China for the PRC. Reciprocal arrows unite both PRC and Taiwan considering the large influence each has on the other.
Relationships
To show the relationship between actors we draw a link, an edge, from one actor to another. Because the relationship is one of influence, from one actor onto another, then the edge is directed and displayed as an arrow. For mutual influence then we draw two arrows between two actors, one from A to B and one from B to A.
Multinational organisations with their own actor
For multinational organisations, which are also actors such as the EU and the AU plus the OAS, we created a node for each organisation. The member states influence the organisation, which, in turn, influences each member state.
Multinational organisations and fora focusing on dialogue
For multinational organisations and fora that are more of an exchange and dialogue type, then we consider that each member influences all other members. The dialogue or associate members are influenced by the members, but not the other way round.
The organisations which are handled in this way are: Five Eyes, the ARF, the ASEAN, the BRIC then BRICS then BRICS+, the Commonwealth of Independent States (CIS), the G20, the G7, the Quad, the SCO.
The case of the UN Security Council Permanent Members
The veto power of each permanent member not only influences the other permanent members but also all the other states. However, for the sake of clarity and simplicity, we decided not to add a directed edge from each permanent member to each and every state. This is an approximation, that must be remembered.
Organisations and fora with a power imbalance
For a couple of multilateral efforts and fora, we considered that one actor is largely more influent than the others.
In that case we described the relationship as one directed edge or arrow from this actor to each of the others. This is an approximation as relationships will run in two directions, and as various member states will learn to cooperate. Yet, as we are looking at influence, we wanted to highlight the importance of the most influential state.
The fora handled in this way are the BRI with China as lead, the CSTO and the defunct Warsaw Pact with Russia as lead, NATO and defunct SEATO with the U.S. as lead.
Measuring influence
To assess influence we use measures specific to graphs called centrality measures. We use the degree centrality, which counts how many edges (arriving and departing) a node has.
For example, let us imagine that at one time t, the node “United States of America” has 10 departing arrows – the U.S. influences 10 actors, and 4 arriving arrows – the U.S. is influences by 4 actors. Hence the degree of the U.S. is 14 (10 + 4).
On the graph, the size of the circle that represents an actor will grow relatively compared with the others according to the degree centrality of each. The larger the circle the more central in terms of degree the actor will be. Thus the more influence compared to the other this actor has.
Furthermore, here, we need to account for time. The software calculates the dynamic degree centrality through iterations considering time intervals. We use average degree for technical reason (CPU usage).
As a result, for our graph, we obtain the following result:

Bounds: from -895708800000,000000 to 2524608000000,000000
Window: 3.1536E10
Tick: 8.64E9
Leave a comment